?unique=1d6fd7c)







































Community
Enterprise
Odoo.sh
All In One Stock Report
The All In One Stock Report module provides a complete suite of advanced stock reporting tools, including stock movement, stock valuation, FSN analysis, non-moving product reports, and product/location-wise stock details. It helps businesses gain clear visibility of stock levels and make accurate, data-driven decisions effortlessly.

Explore This Module

Overview
The All In One Stock Report module provides a powerful collection of advanced stock reporting tools designed to enhance stock visibility and decision-making. It includes stock movement tracking, stock valuation reports, FSN analysis, non-moving product detection, and detailed product-wise and location-wise stock reports. With easy-to-use wizards, and PDF/XLSX exports, this module offers a complete solution for managing and analyzing stock efficiently.

Features
Available in Odoo 19.0 Community and Enterprise.

Access multiple detailed stock reports including movement, valuation, FSN, non-moving items, and product/location-based stock.

Analyze stock valuation based on real-time valuation layers with accurate cost tracking.

Filter reports by date, product, category, location, company, warehouse, and more for precise analysis.

Identify fast-moving, slow-moving, and non-moving items using advanced analysis methods.

Export all stock reports instantly in both PDF and Excel formats with clean, user-friendly layouts.

Easy-to-use interface, wizard-based filtering, and fast report generation for quick decision-making.

Screenshots
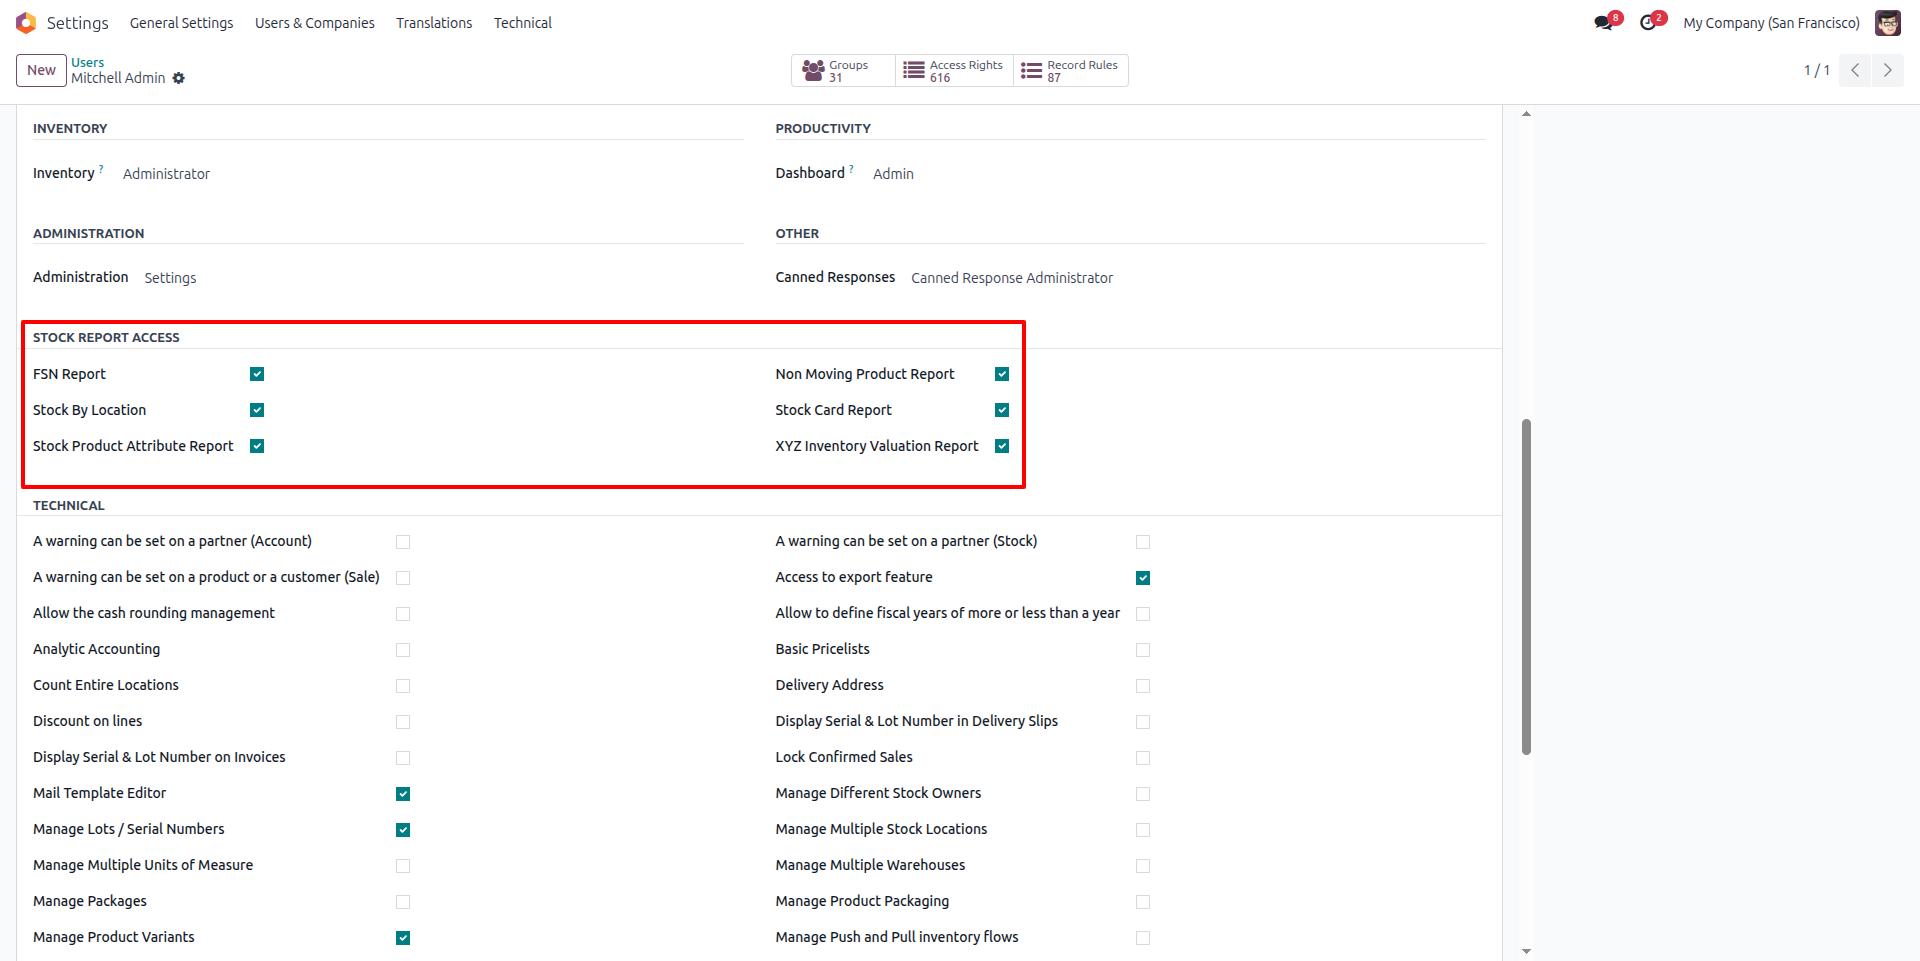
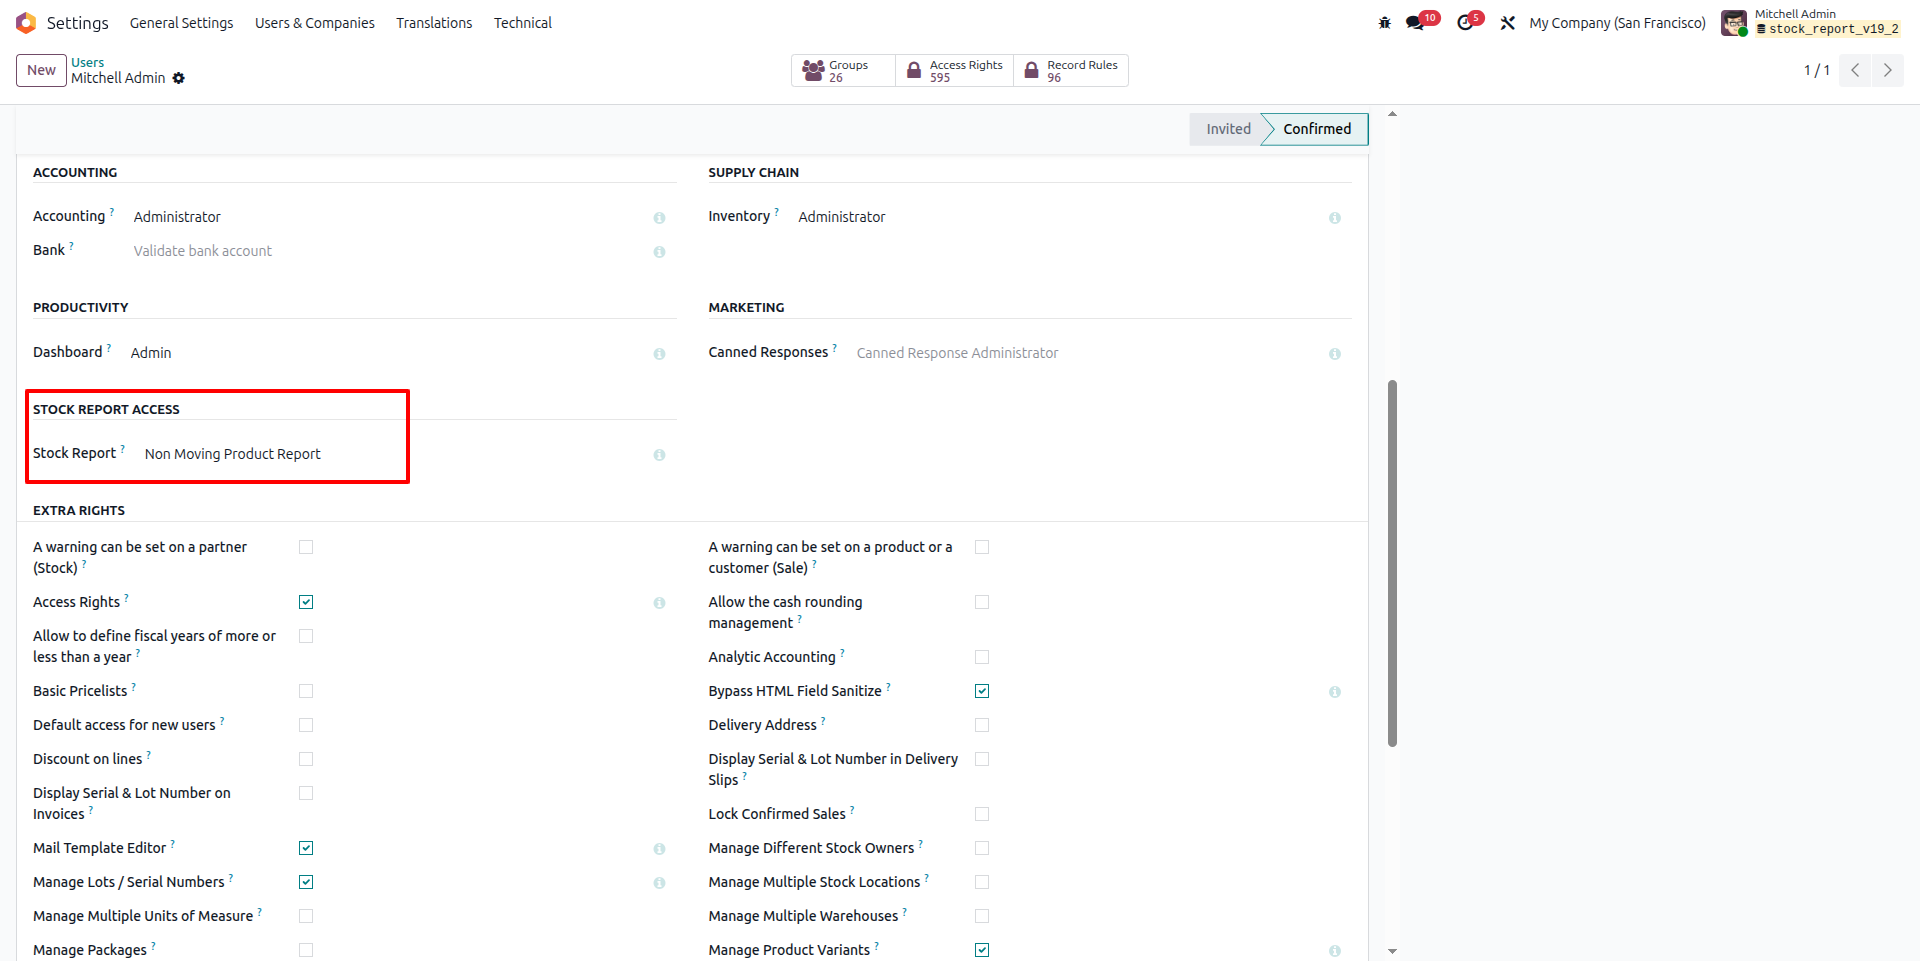
Stock Report Access Configuration
This section allows administrators to manage user access to various stock reports. You can enable or disable permissions for each report directly from the user settings panel.
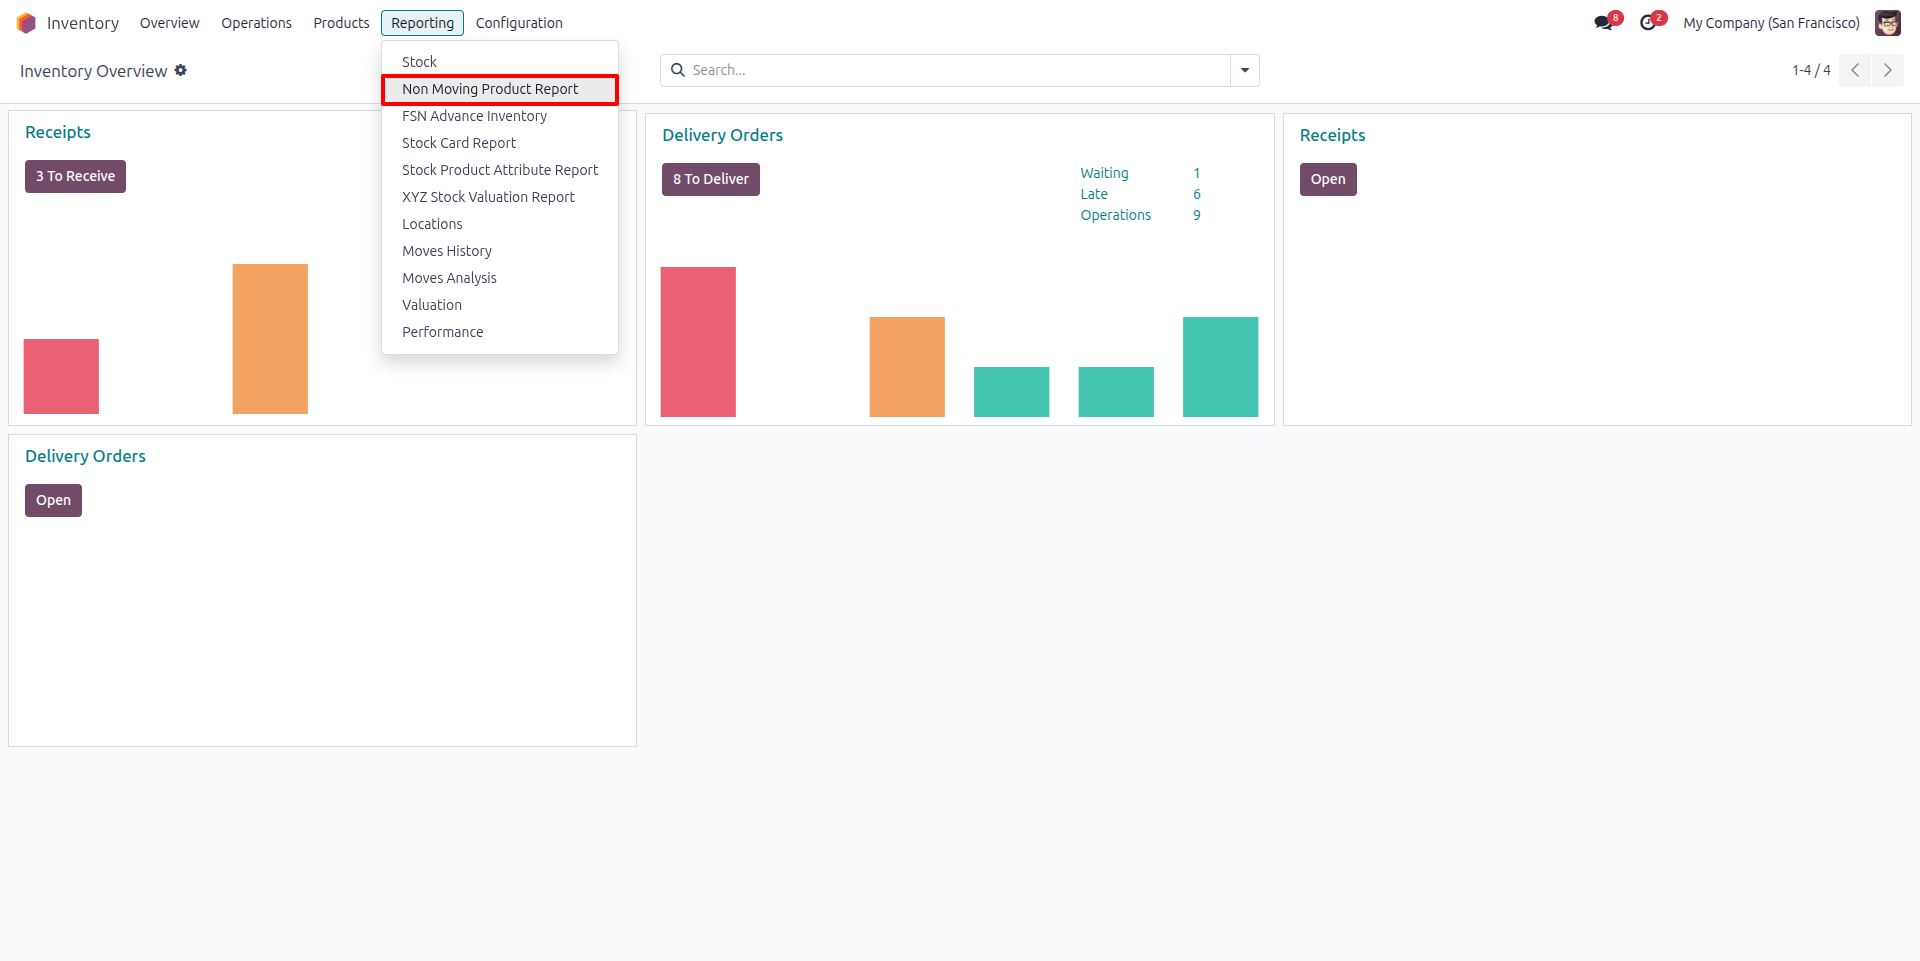
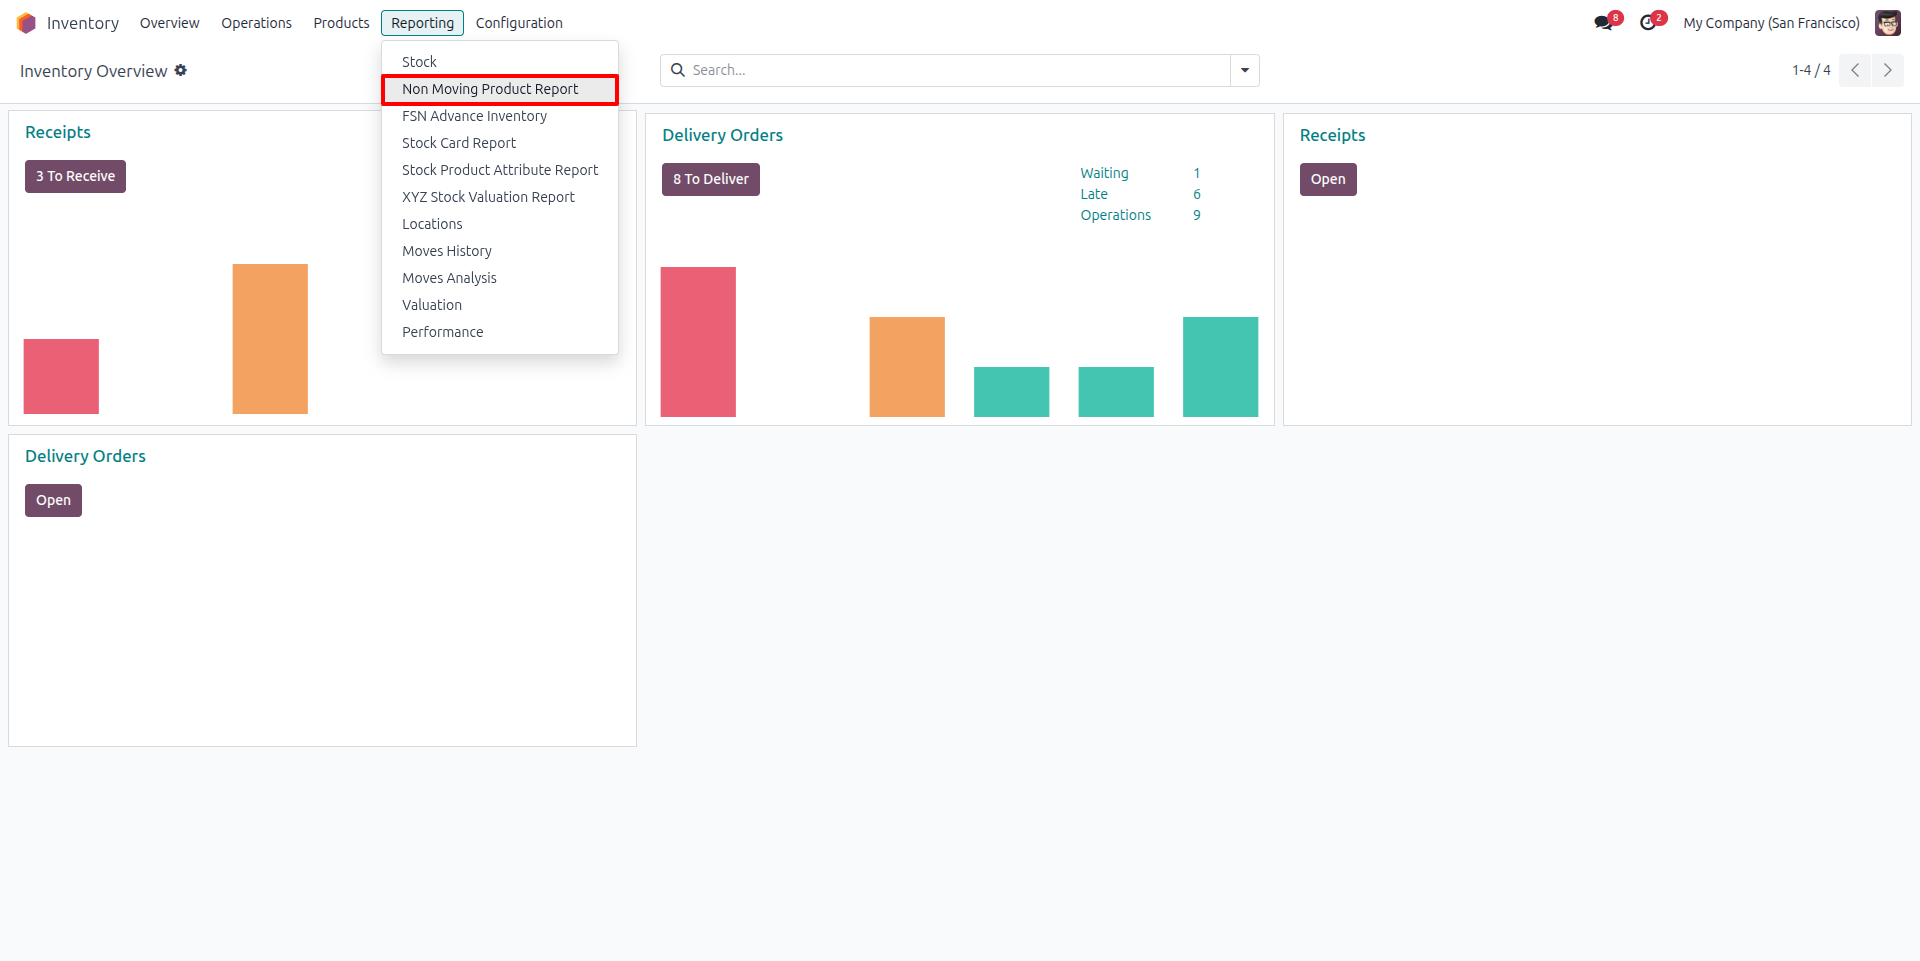
Non-Moving Product Report Menu Access
The Inventory → Reporting menu includes a new “Non Moving Product Report” option, allowing users to quickly access and analyze products with no stock movement.
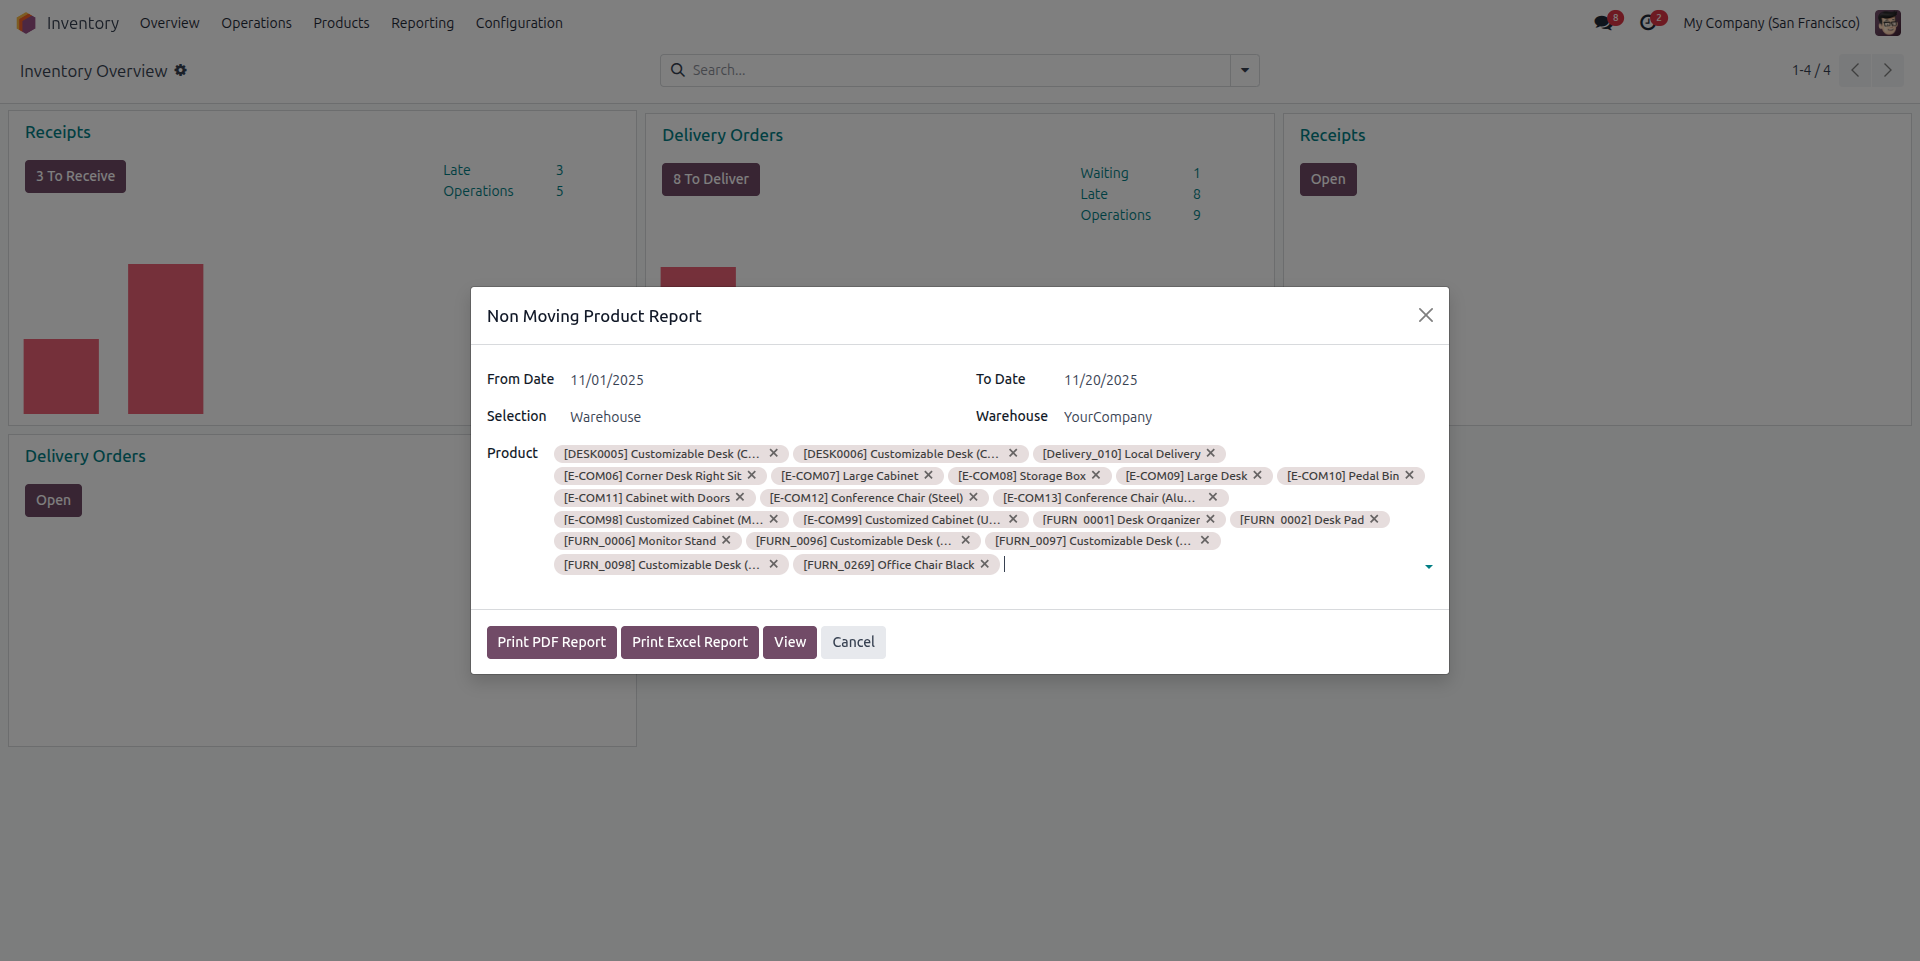
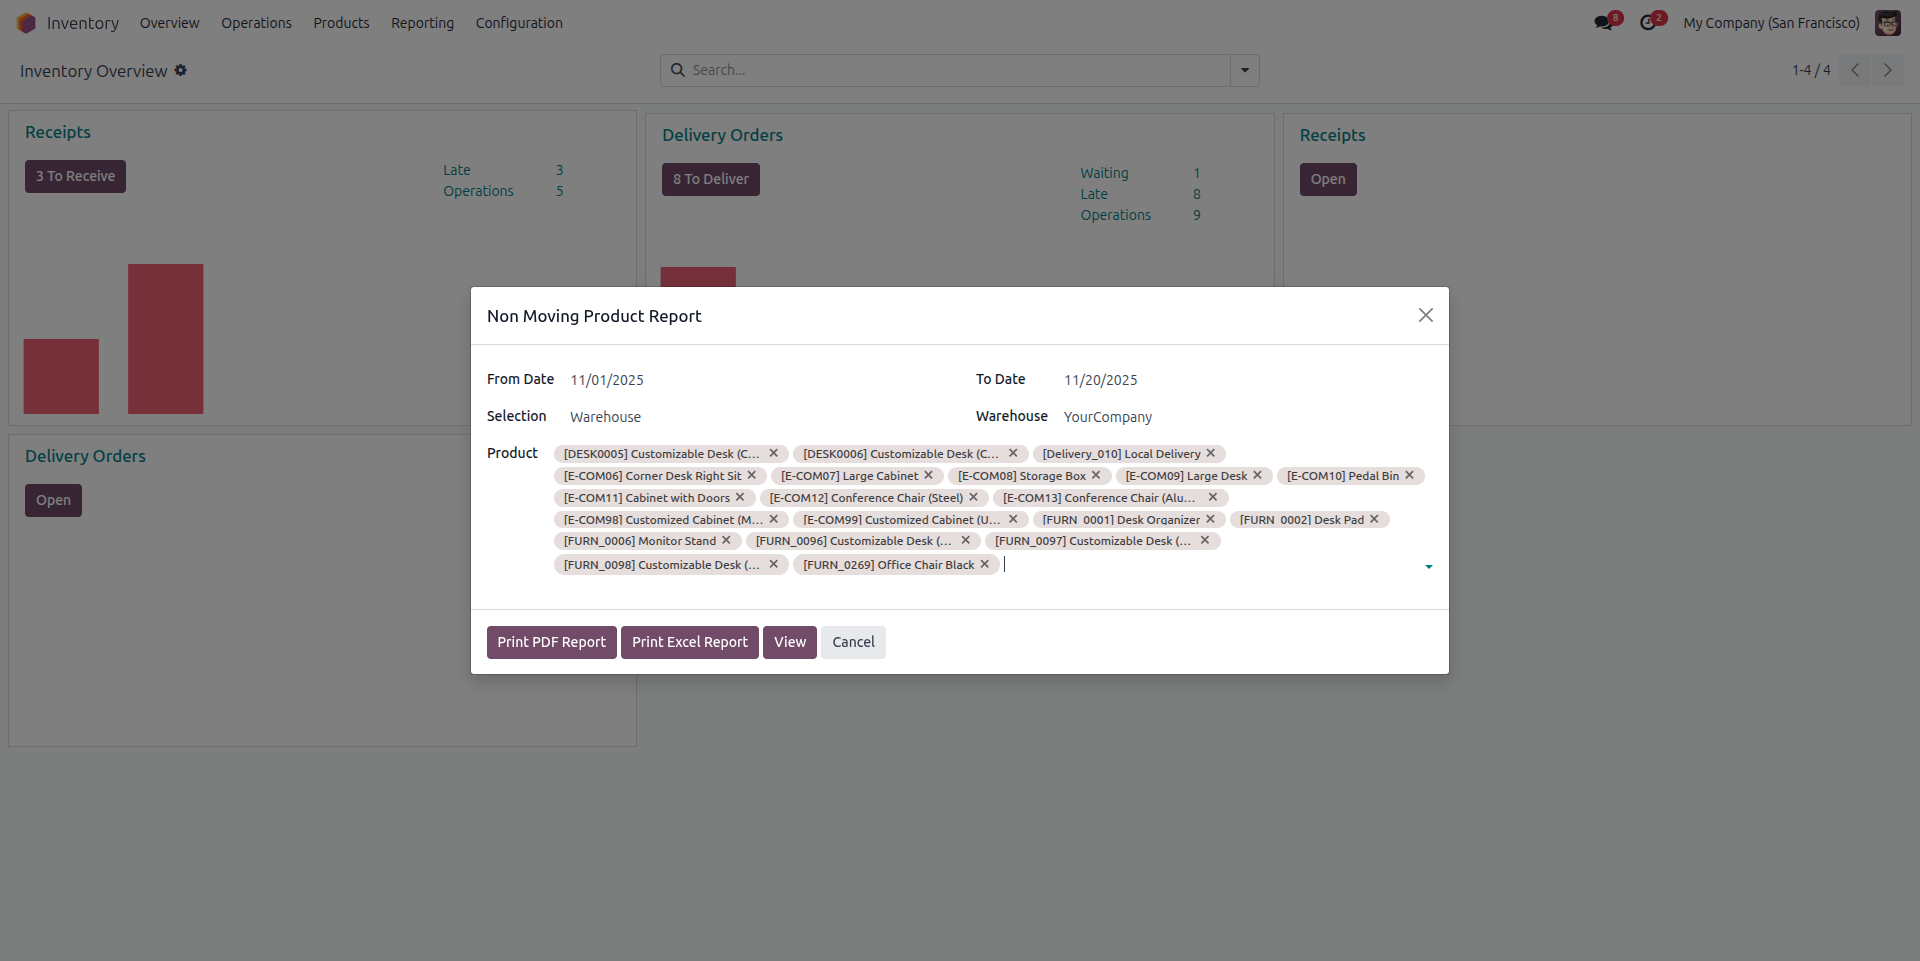
Non-Moving Product Report Wizard
The Non-Moving Product Report wizard allows users to select a date range, choose a warehouse, and pick products for analysis. It also provides options to generate the report in PDF, Excel, or view it directly on screen.
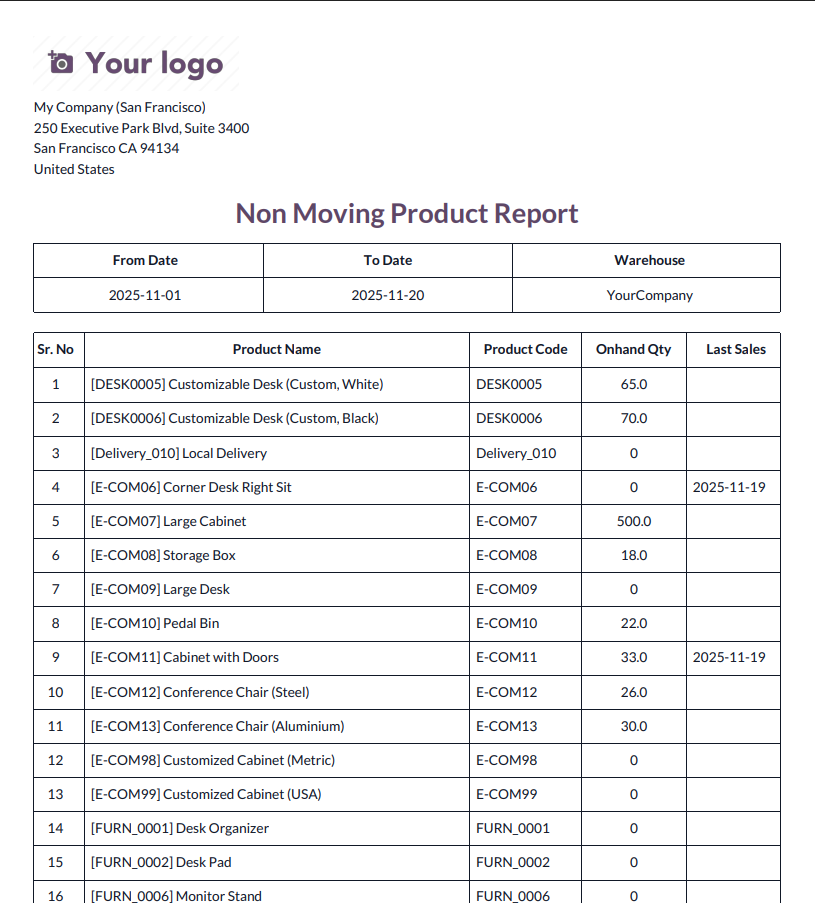
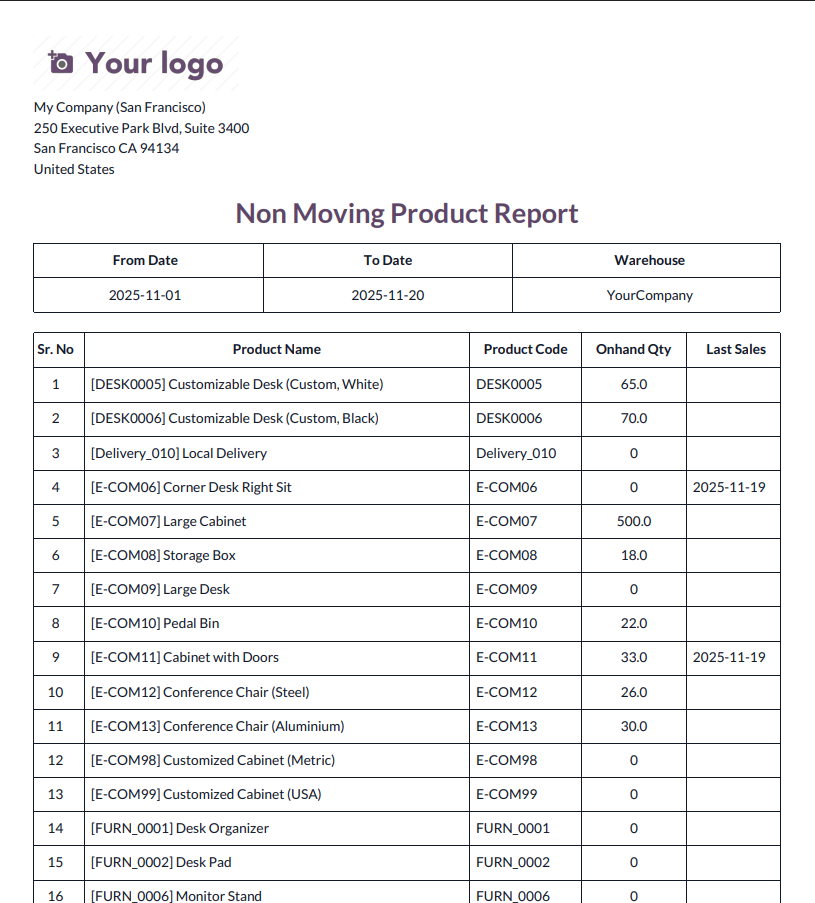
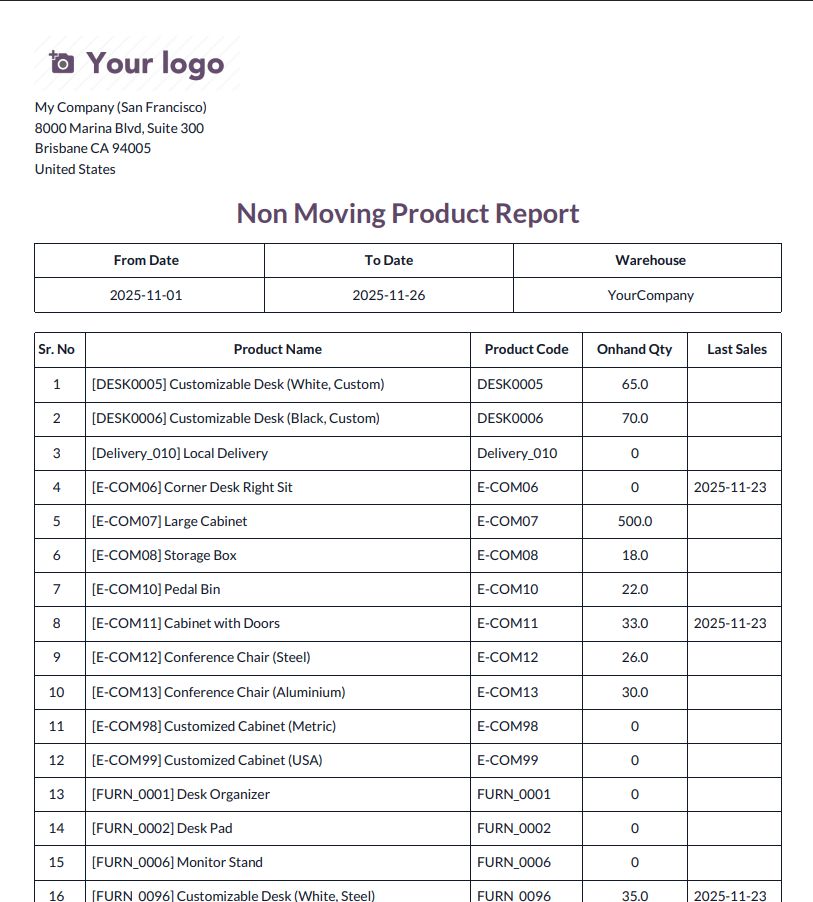
Non-Moving Product PDF Report
This report displays a list of products with no recent stock movement within the selected date range. It includes product name, product code, on-hand quantity, warehouse, and last sales date, helping users identify items that remain unsold or unused.
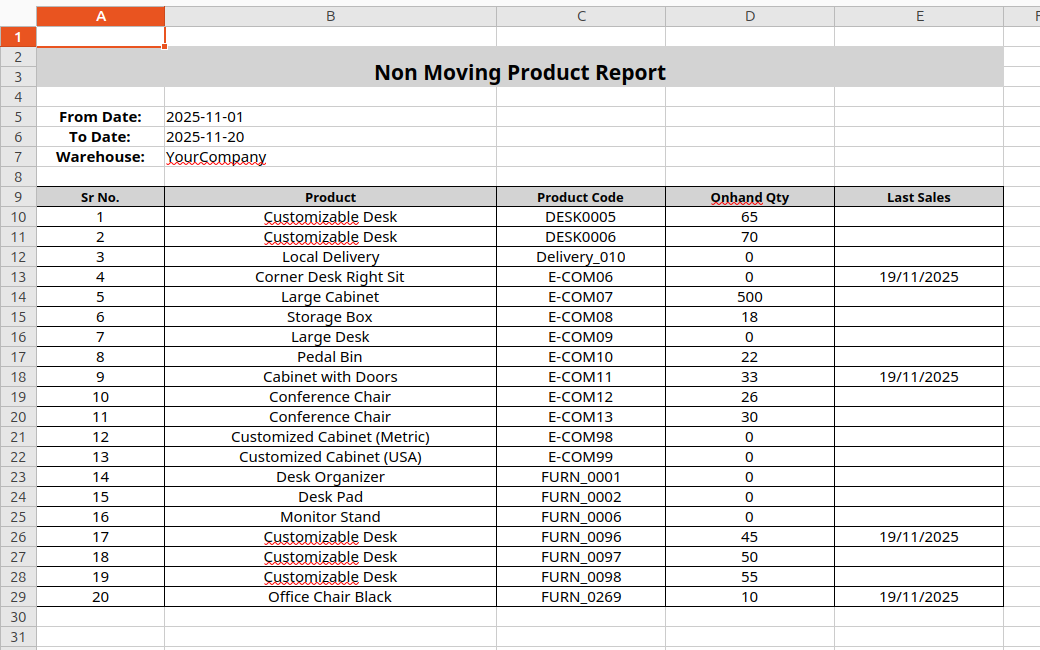
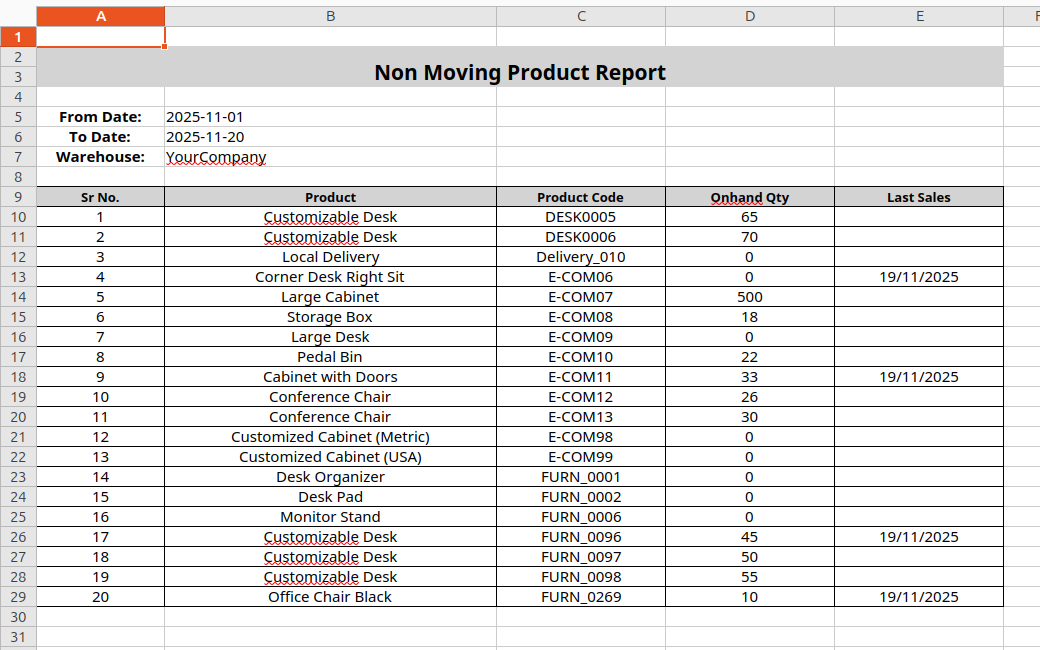
Non-Moving Product Excel Report
This Excel report lists all products with no recent stock movement within the selected date range. It includes product name, product code, on-hand quantity, last sales date, and warehouse details, making it easy to analyze non-moving items directly in Excel.
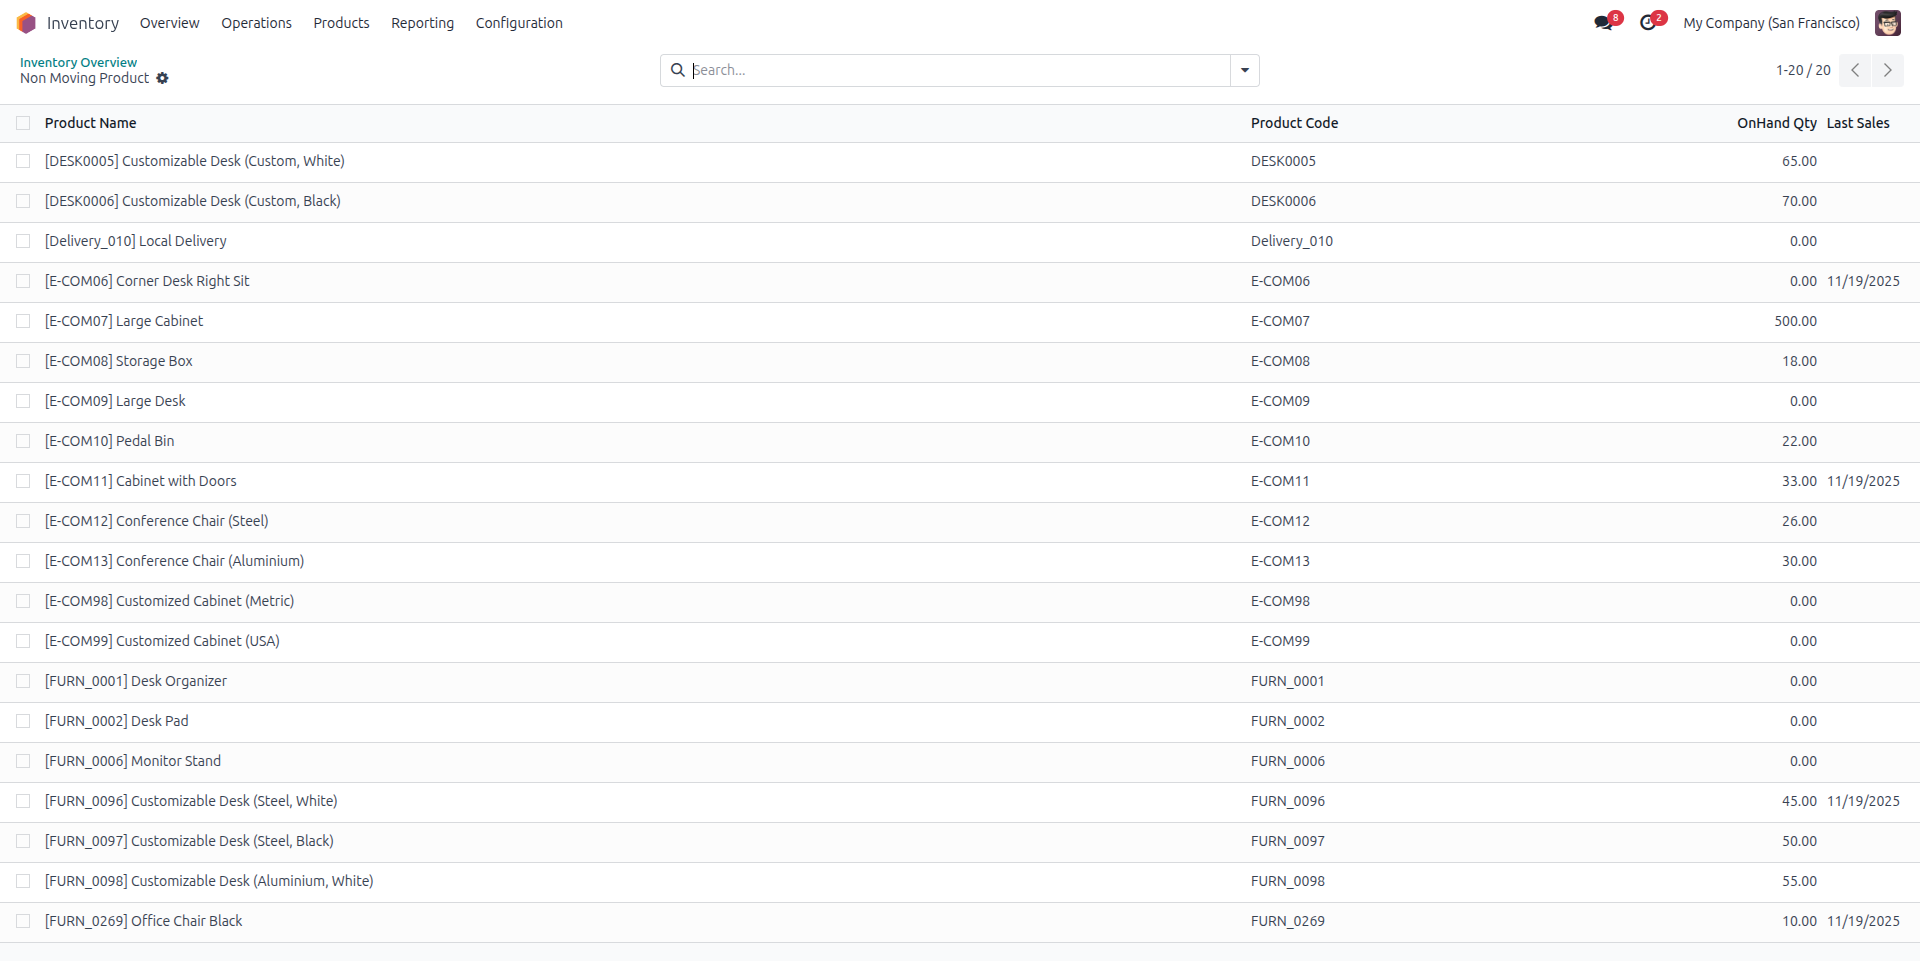
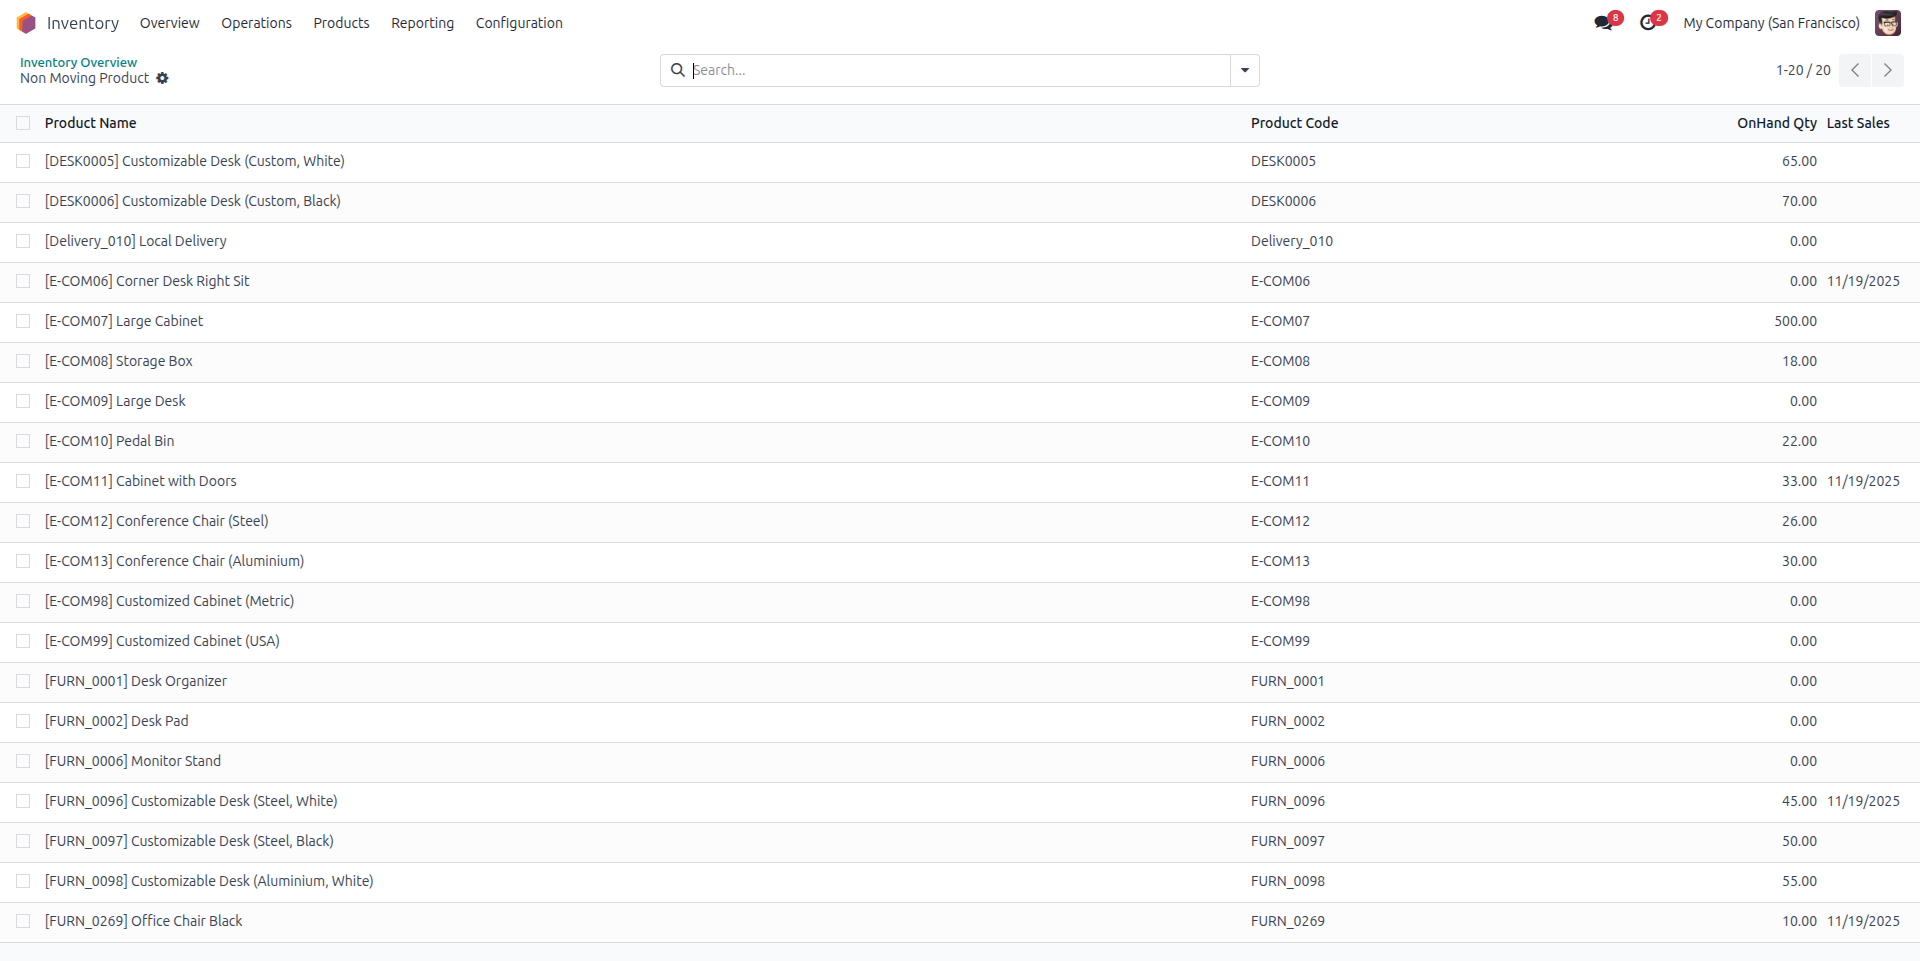
Non-Moving Product Report List View
This list view displays all products with no recent stock movement, showing key details such as product name, product code, on-hand quantity, and last sales date. It allows users to quickly analyze non-moving items directly within the Odoo interface.
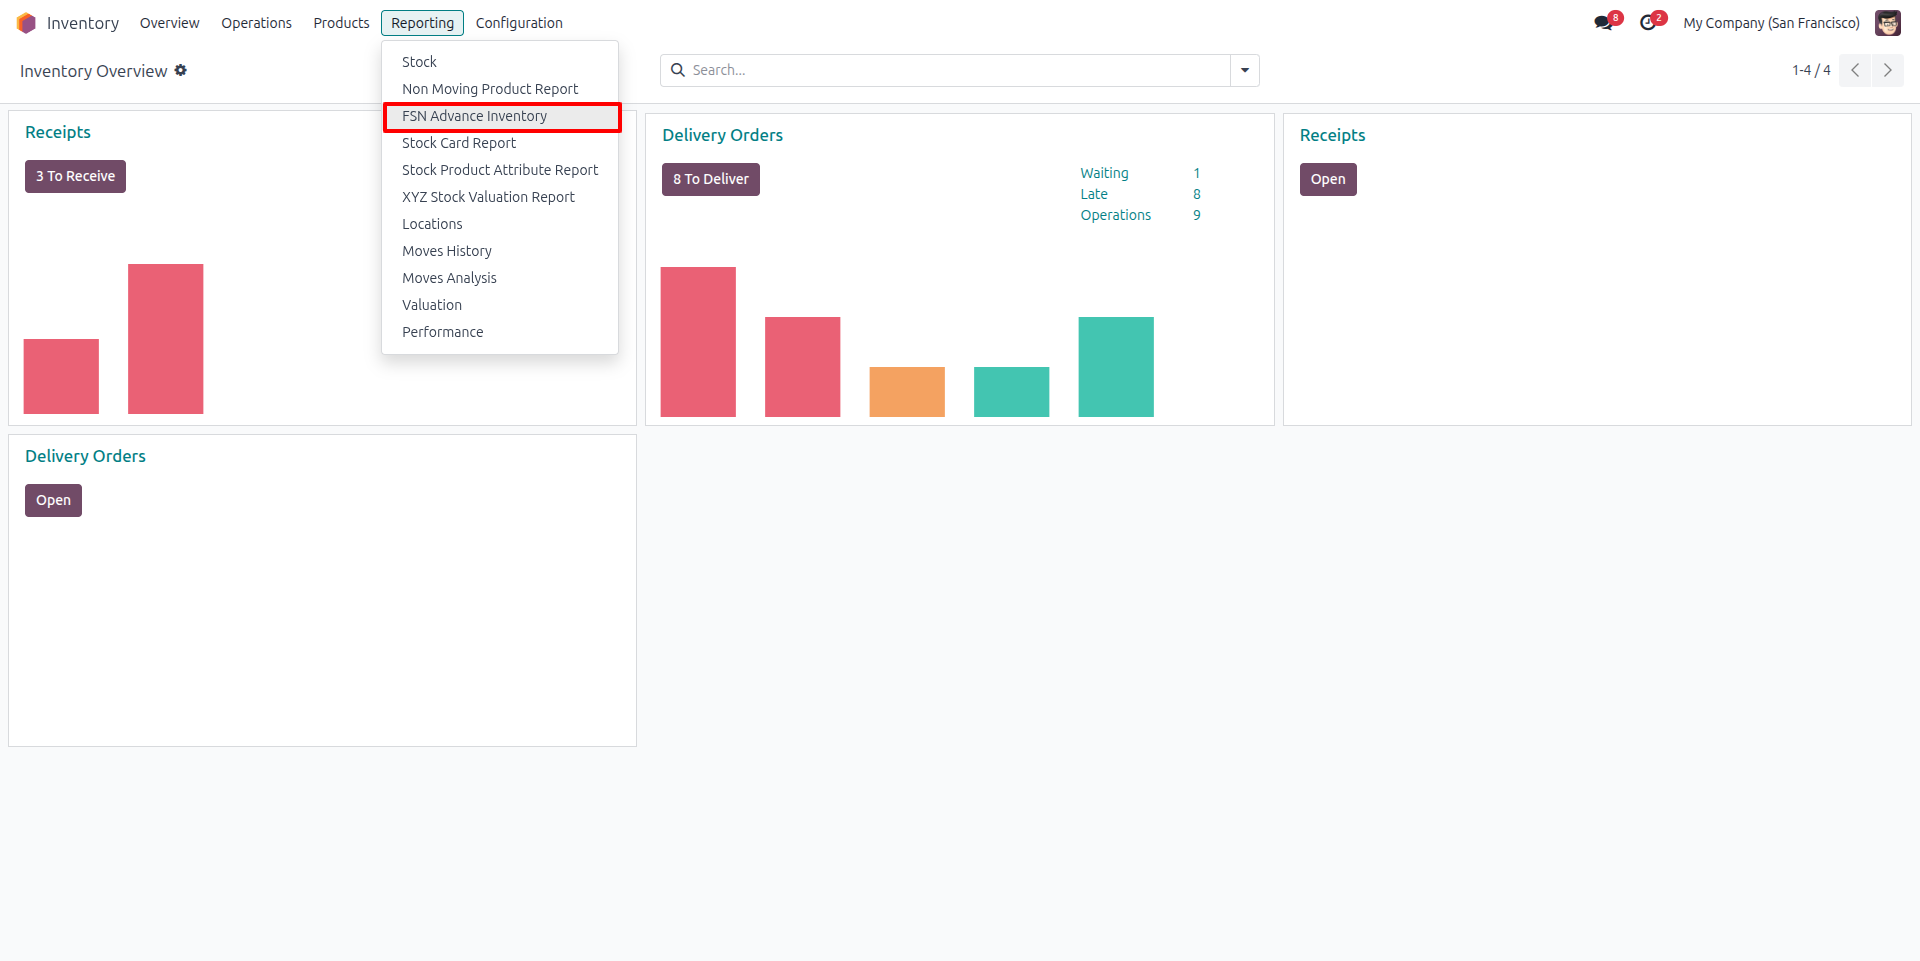
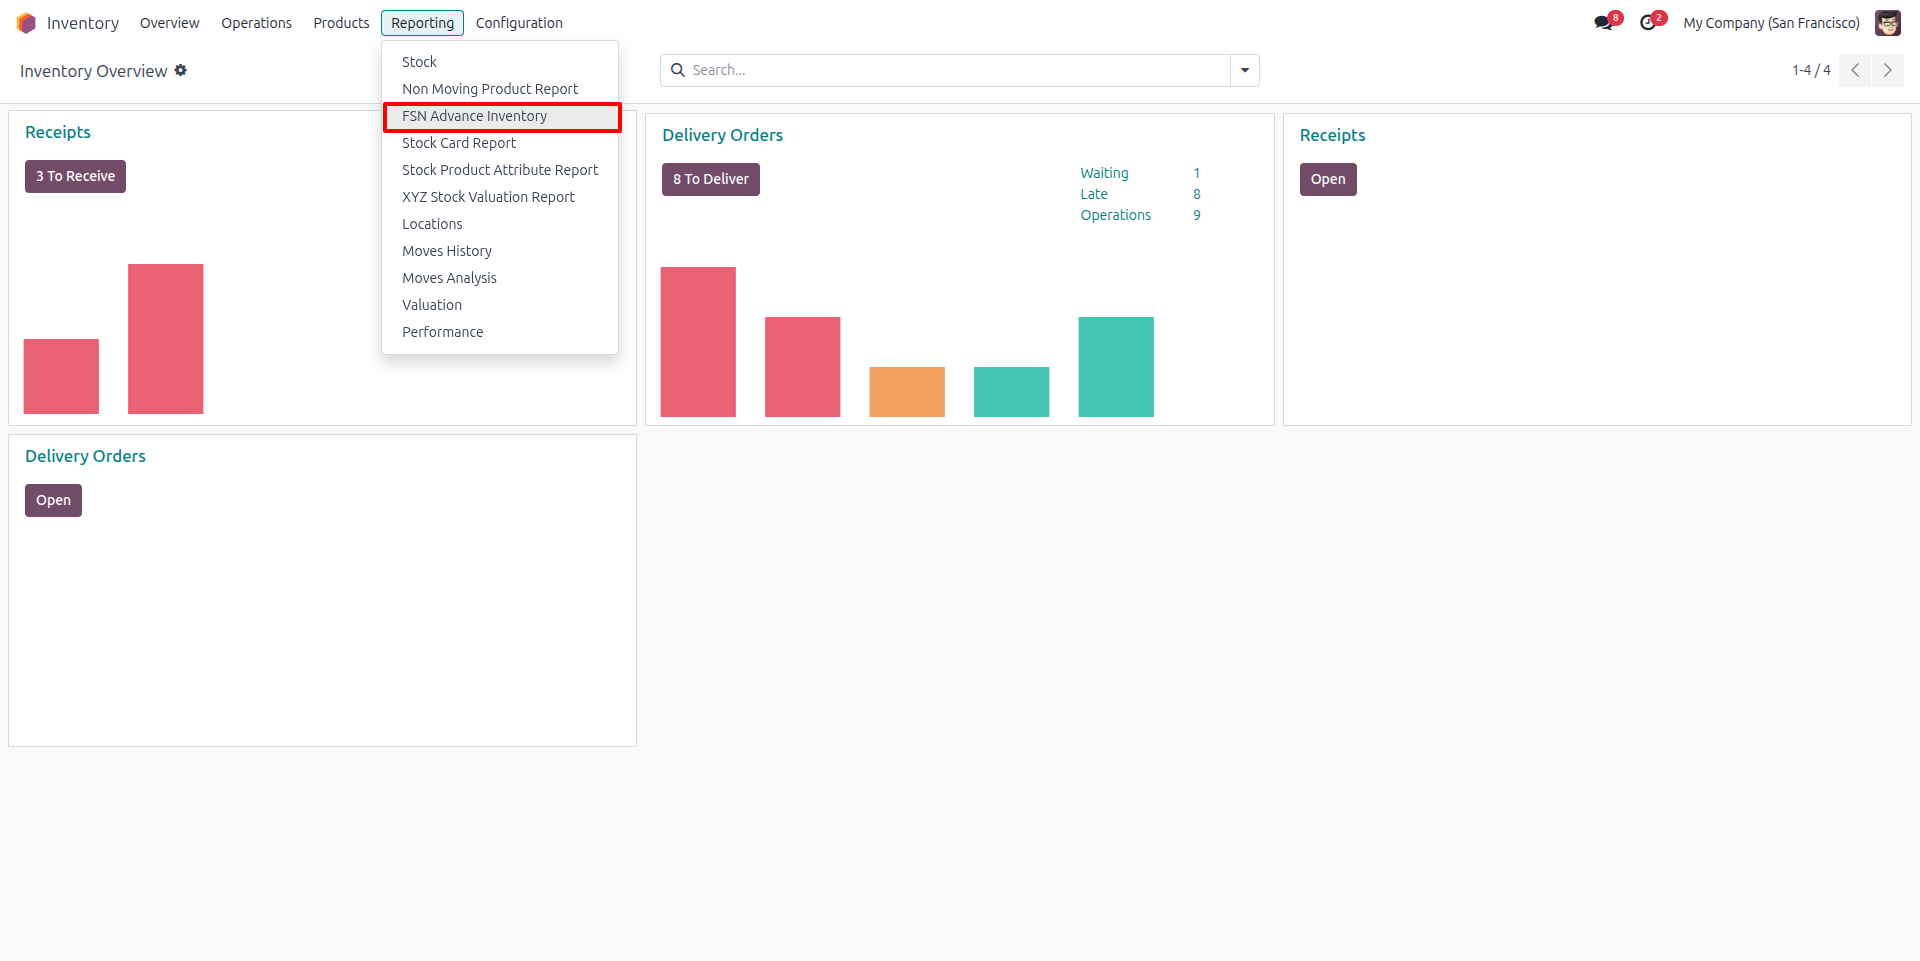
FSN Advance Inventory Menu Access
The Reporting menu in the Inventory module includes a new “FSN Advance Inventory” option. Users can open this report directly from the dropdown to analyze products categorized as Fast-moving, Slow-moving, or Non-moving.
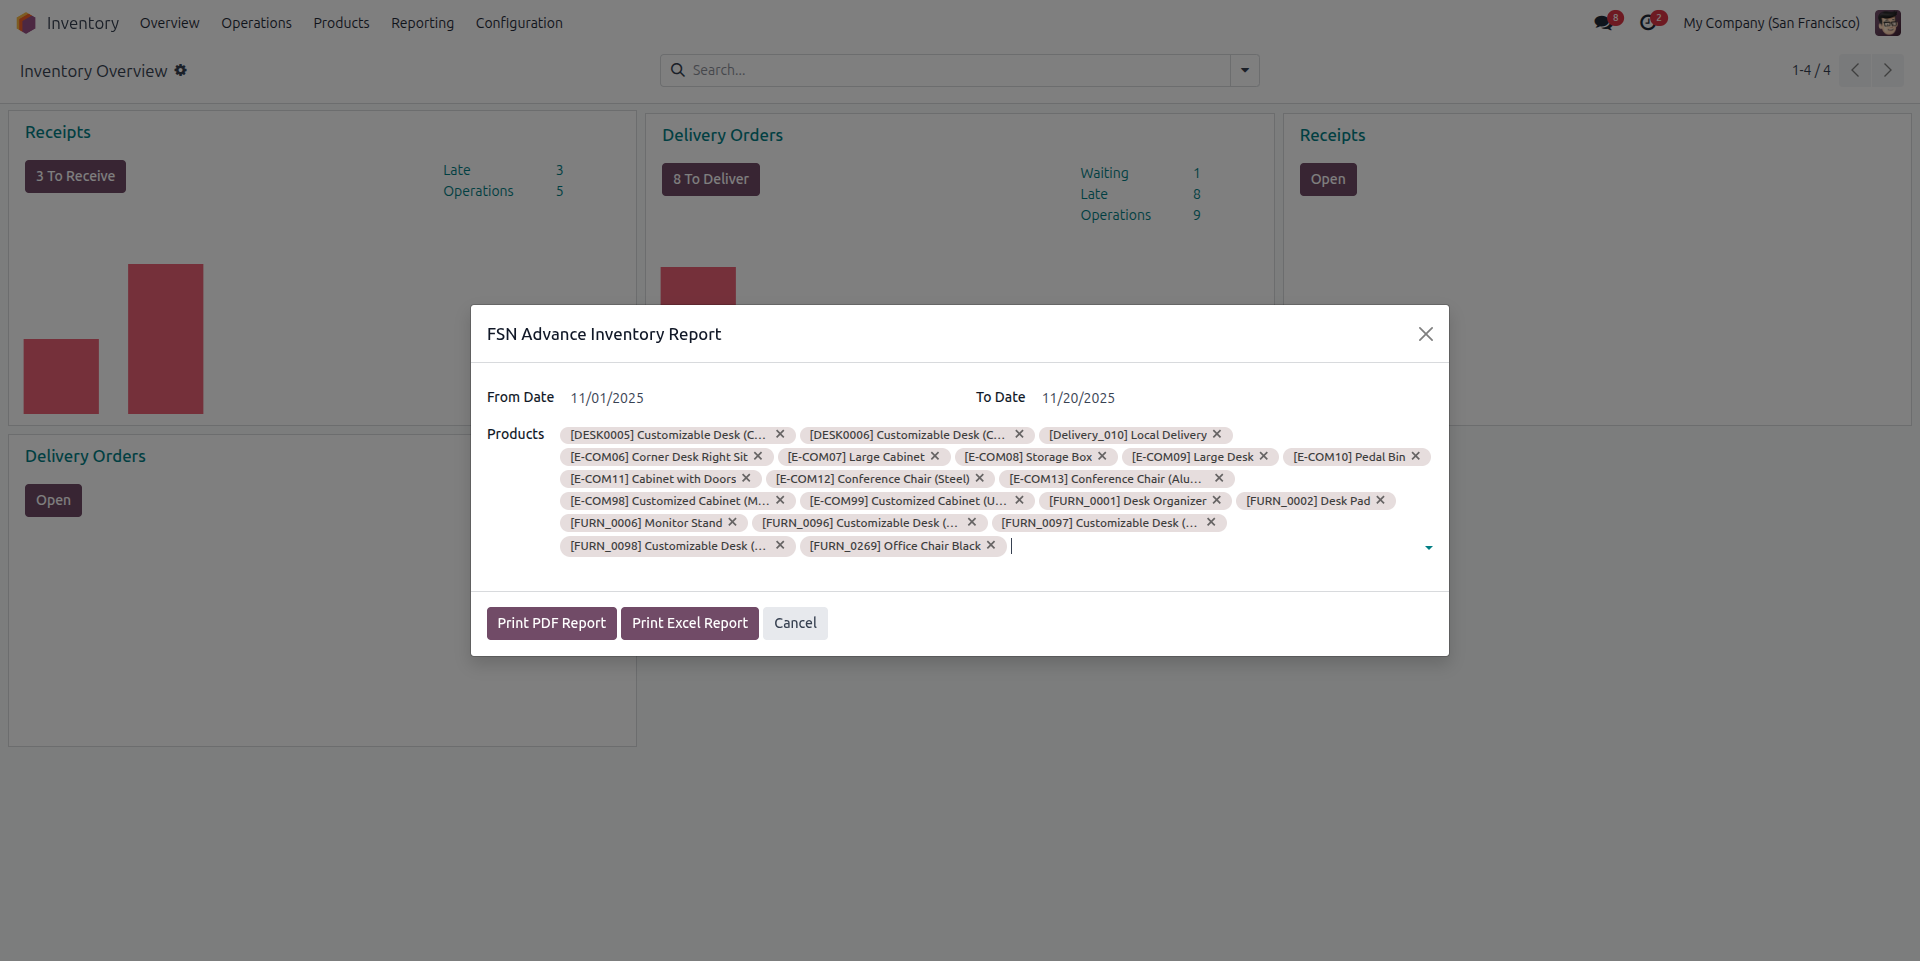
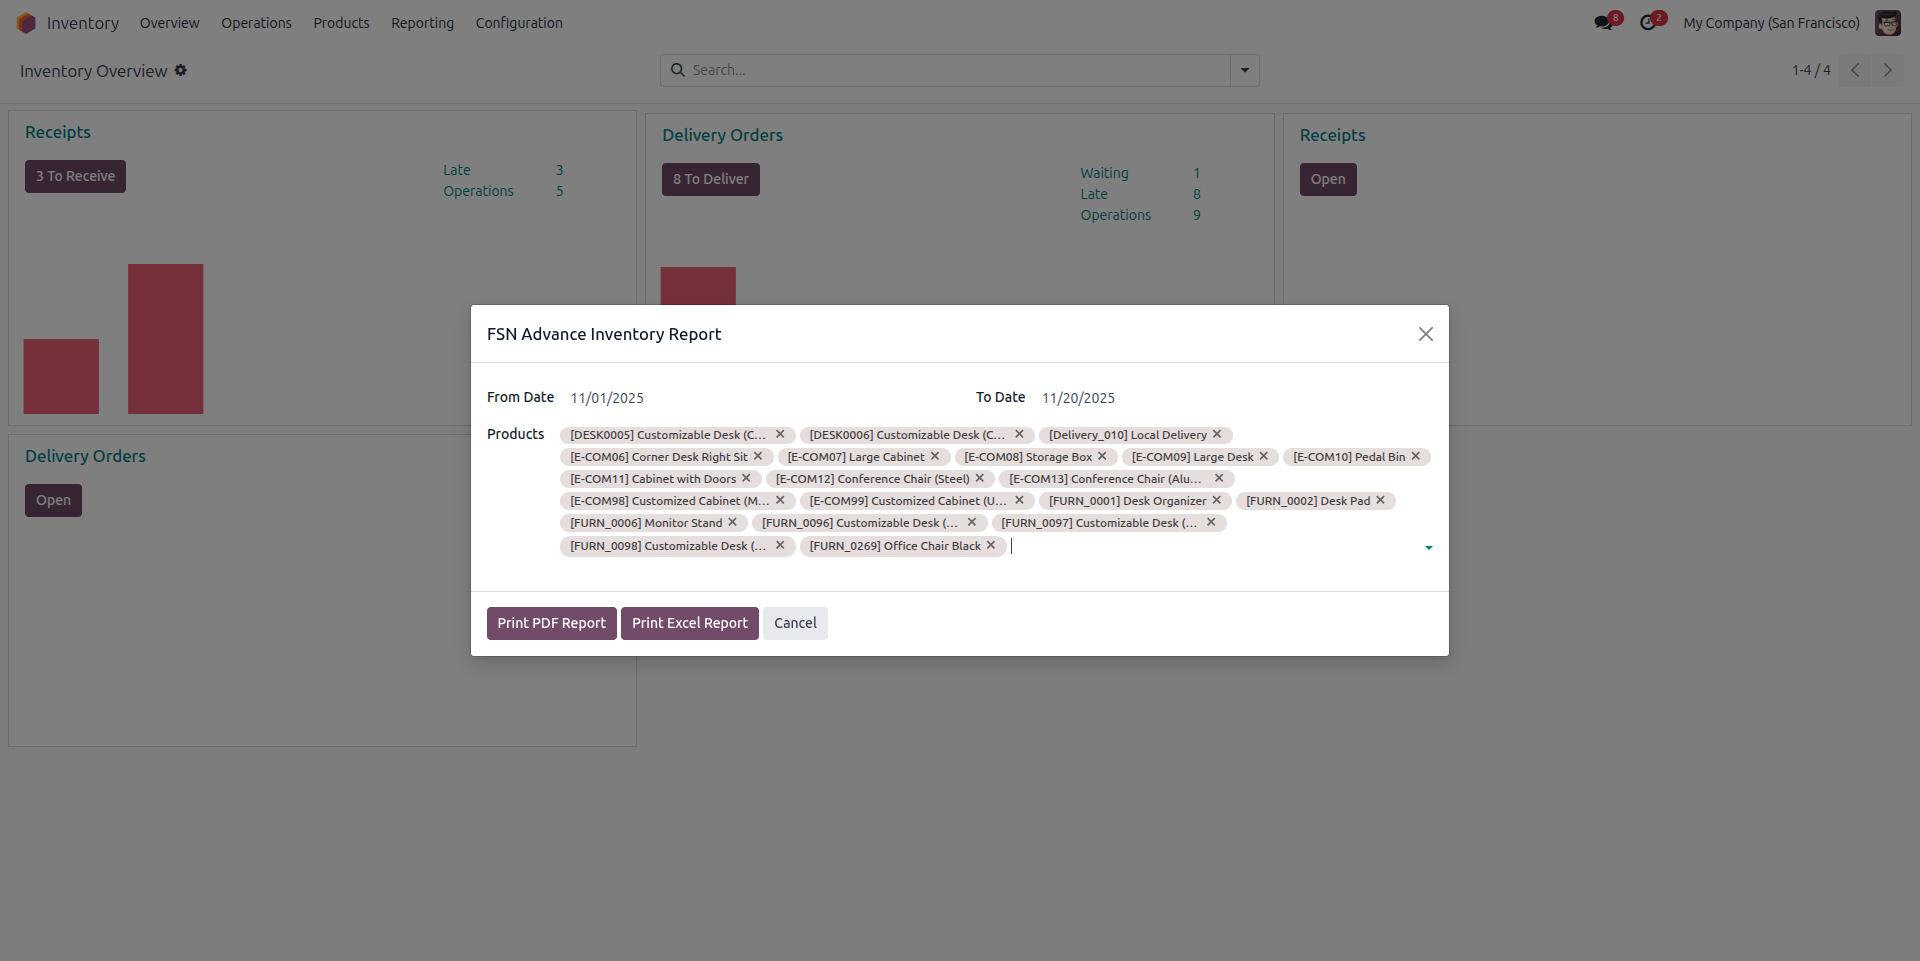
FSN Advance Inventory Report Wizard
The FSN Advance Inventory Report wizard allows users to select a date range and choose specific products to analyze Fast-moving, Slow-moving, and Non-moving items. It also provides options to generate the report in PDF or Excel formats.
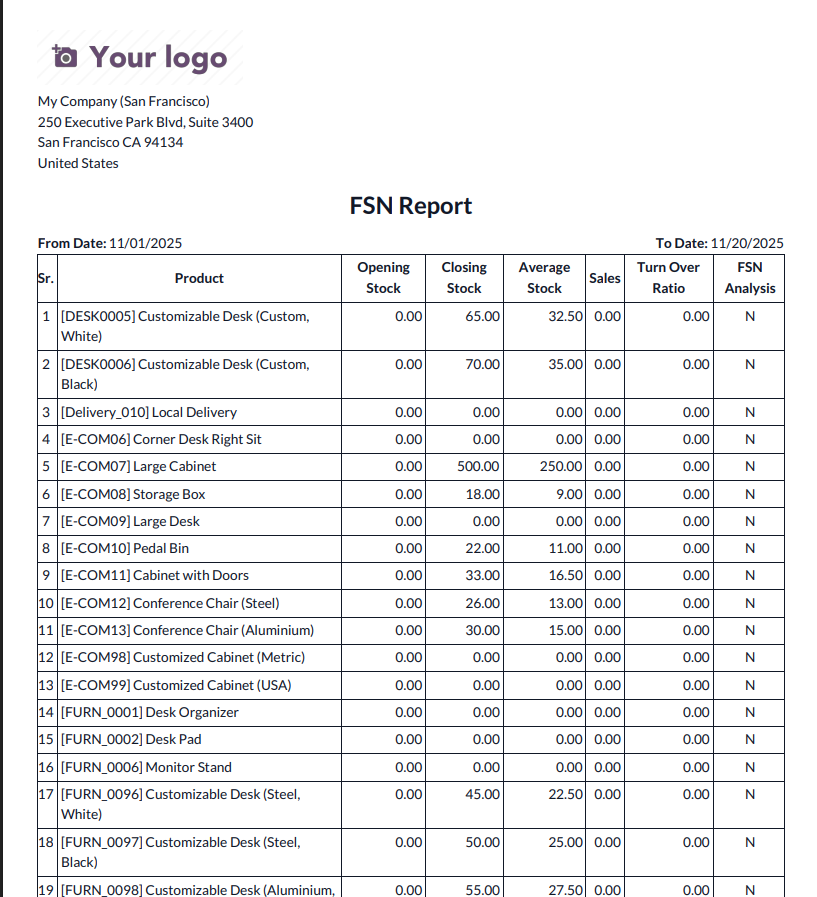
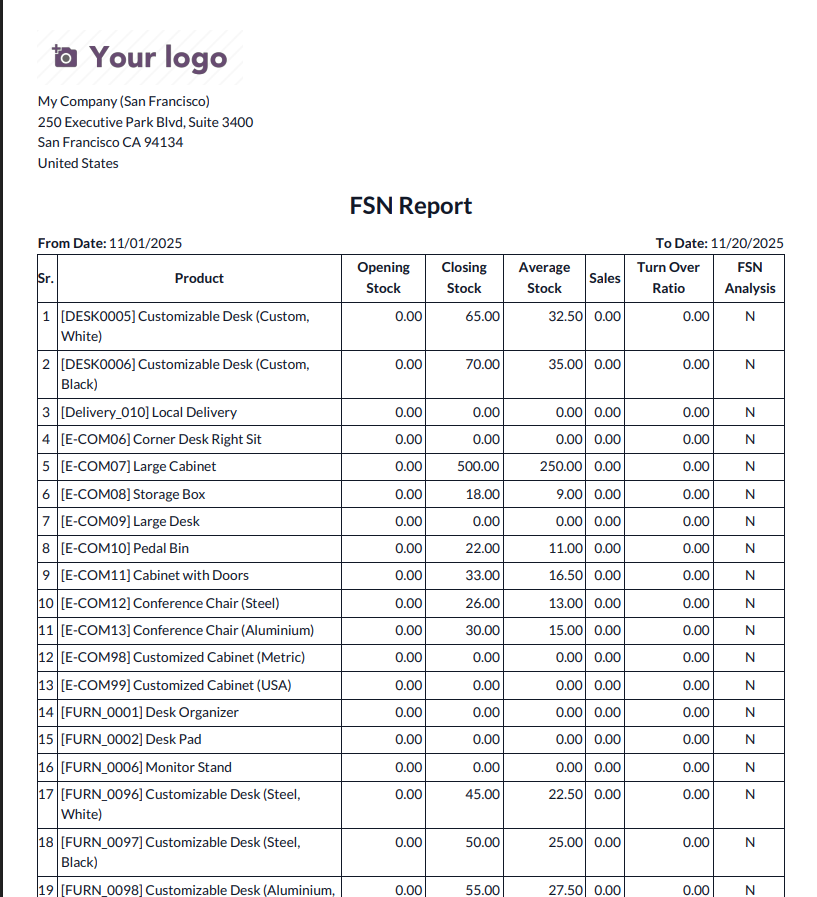
FSN PDF Report
This FSN Report provides a detailed analysis of product movement by showing opening stock, closing stock, average stock, sales, turnover ratio, and FSN classification (Fast, Slow, or Non-moving). It helps users evaluate product performance over the selected date range.
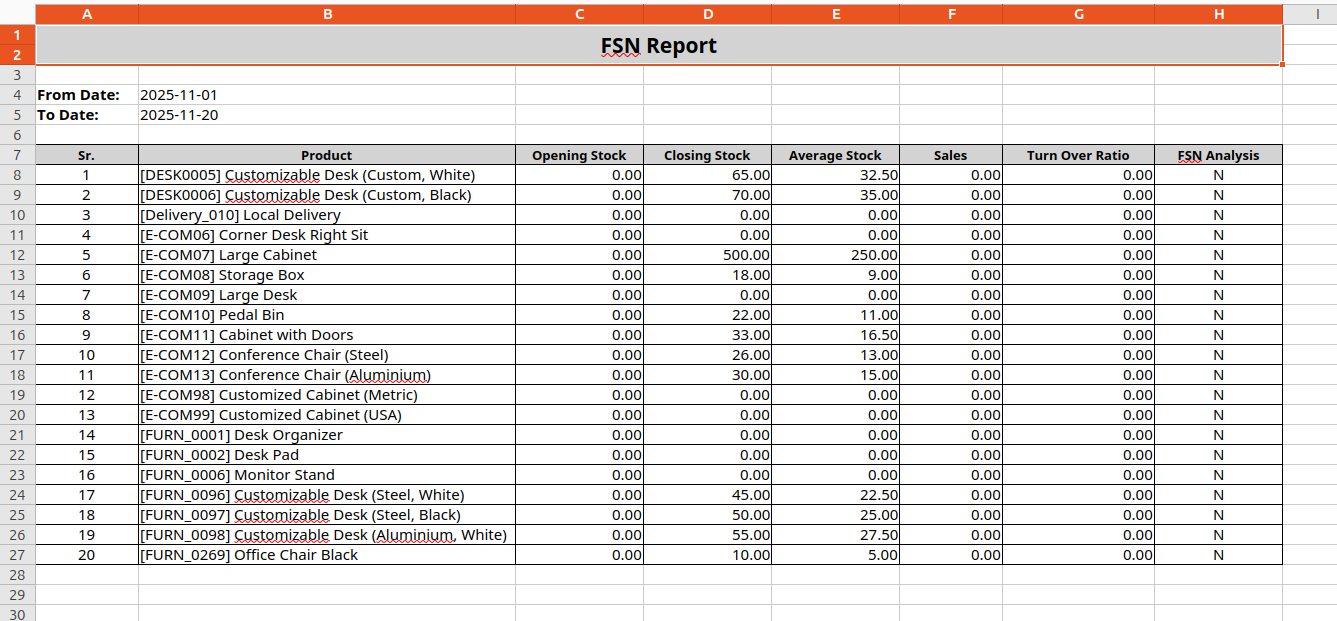
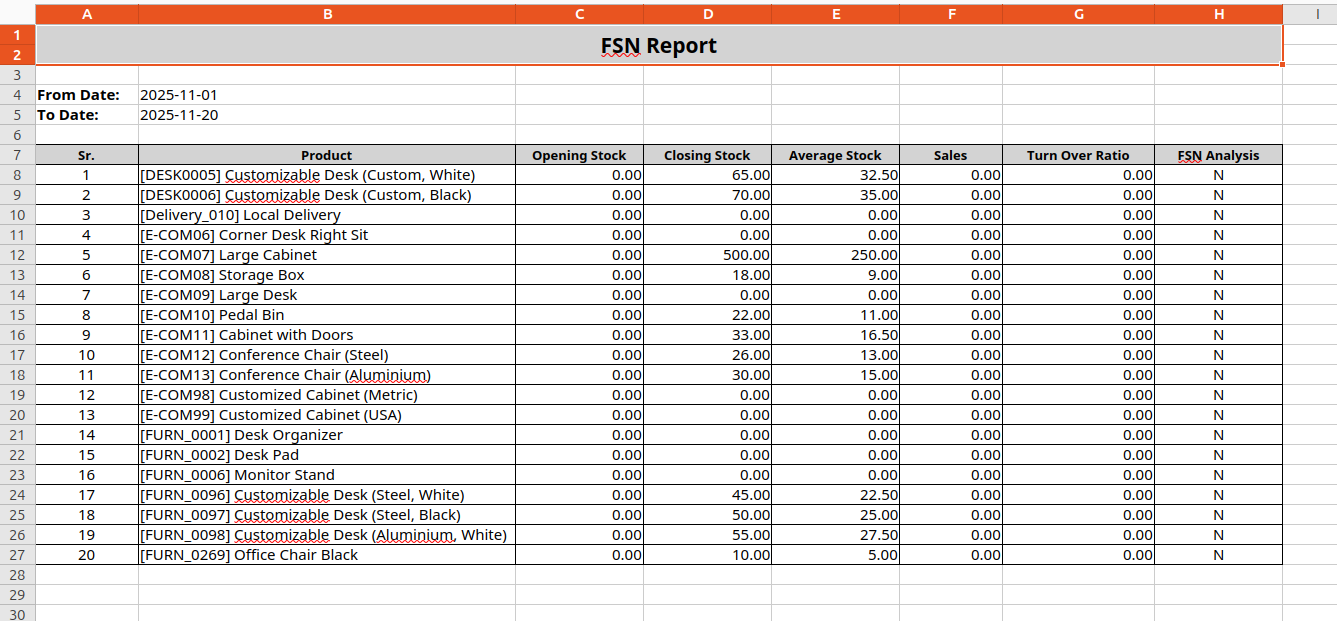
FSN Excel Report
This Excel format of the FSN Report provides detailed product movement analysis, including opening stock, closing stock, average stock, sales, turnover ratio, and FSN classification. It allows users to easily review Fast, Slow, and Non-moving product performance within the selected date range.
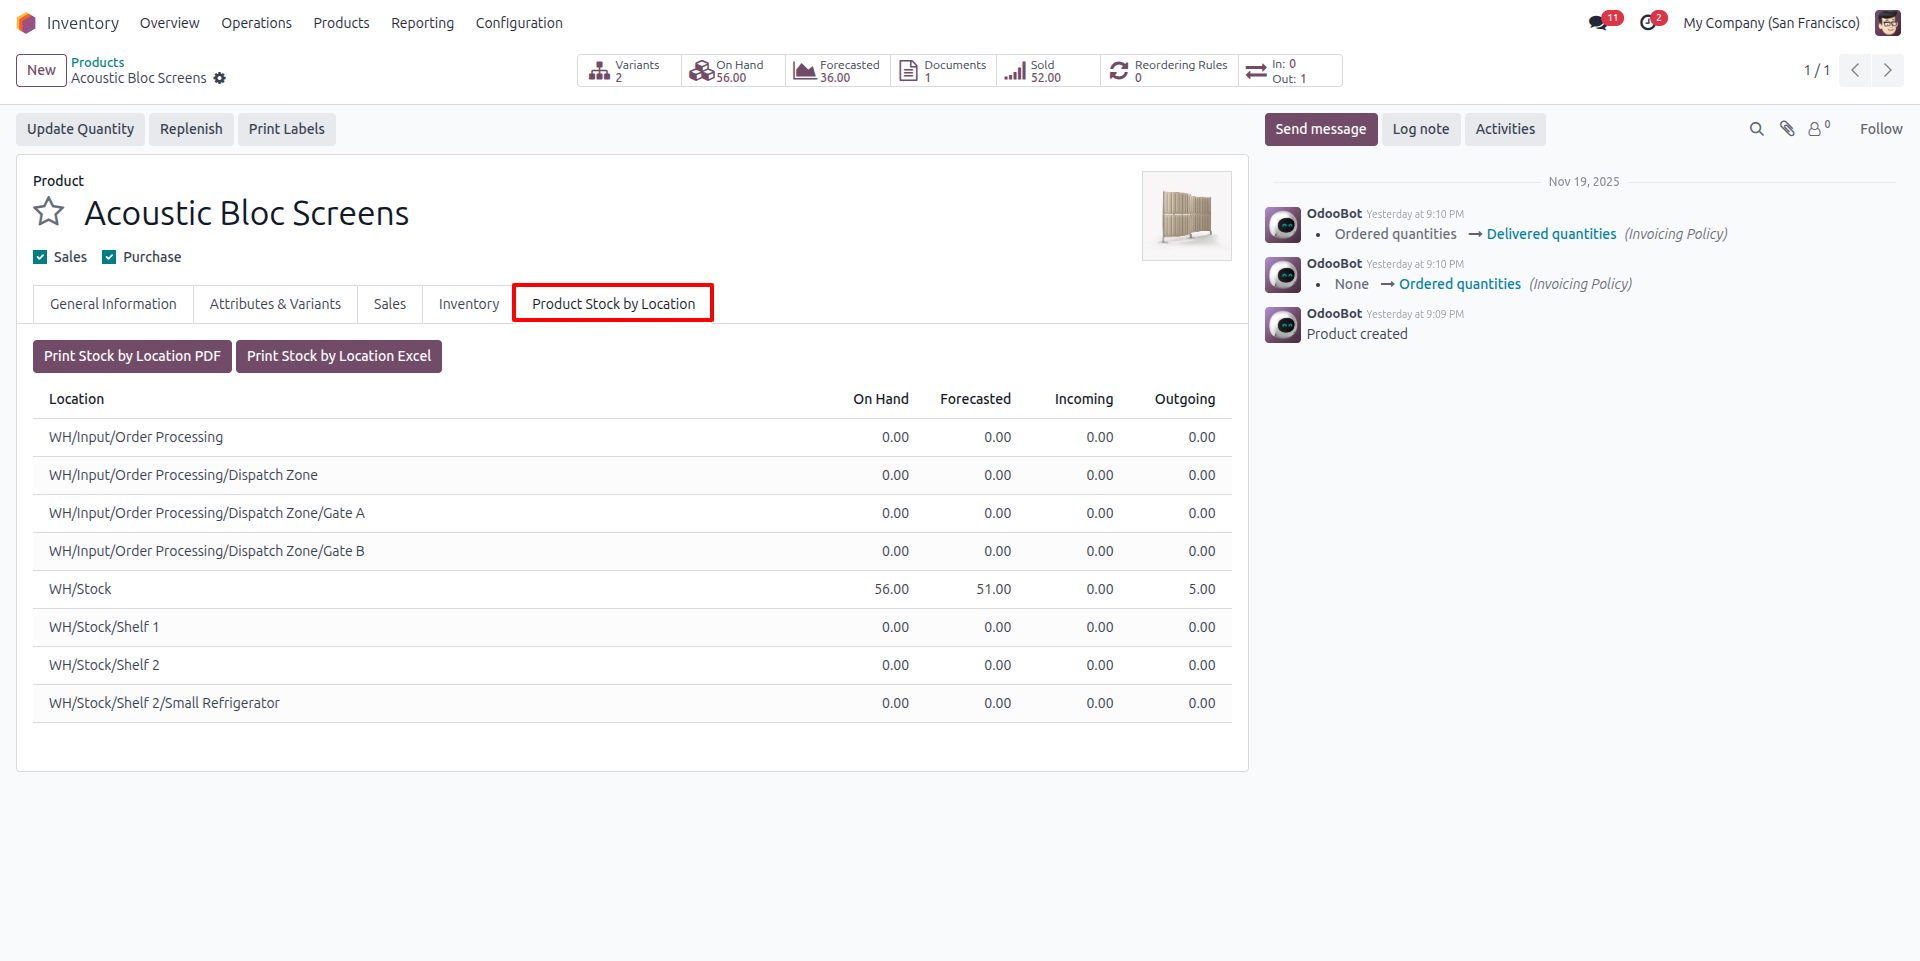
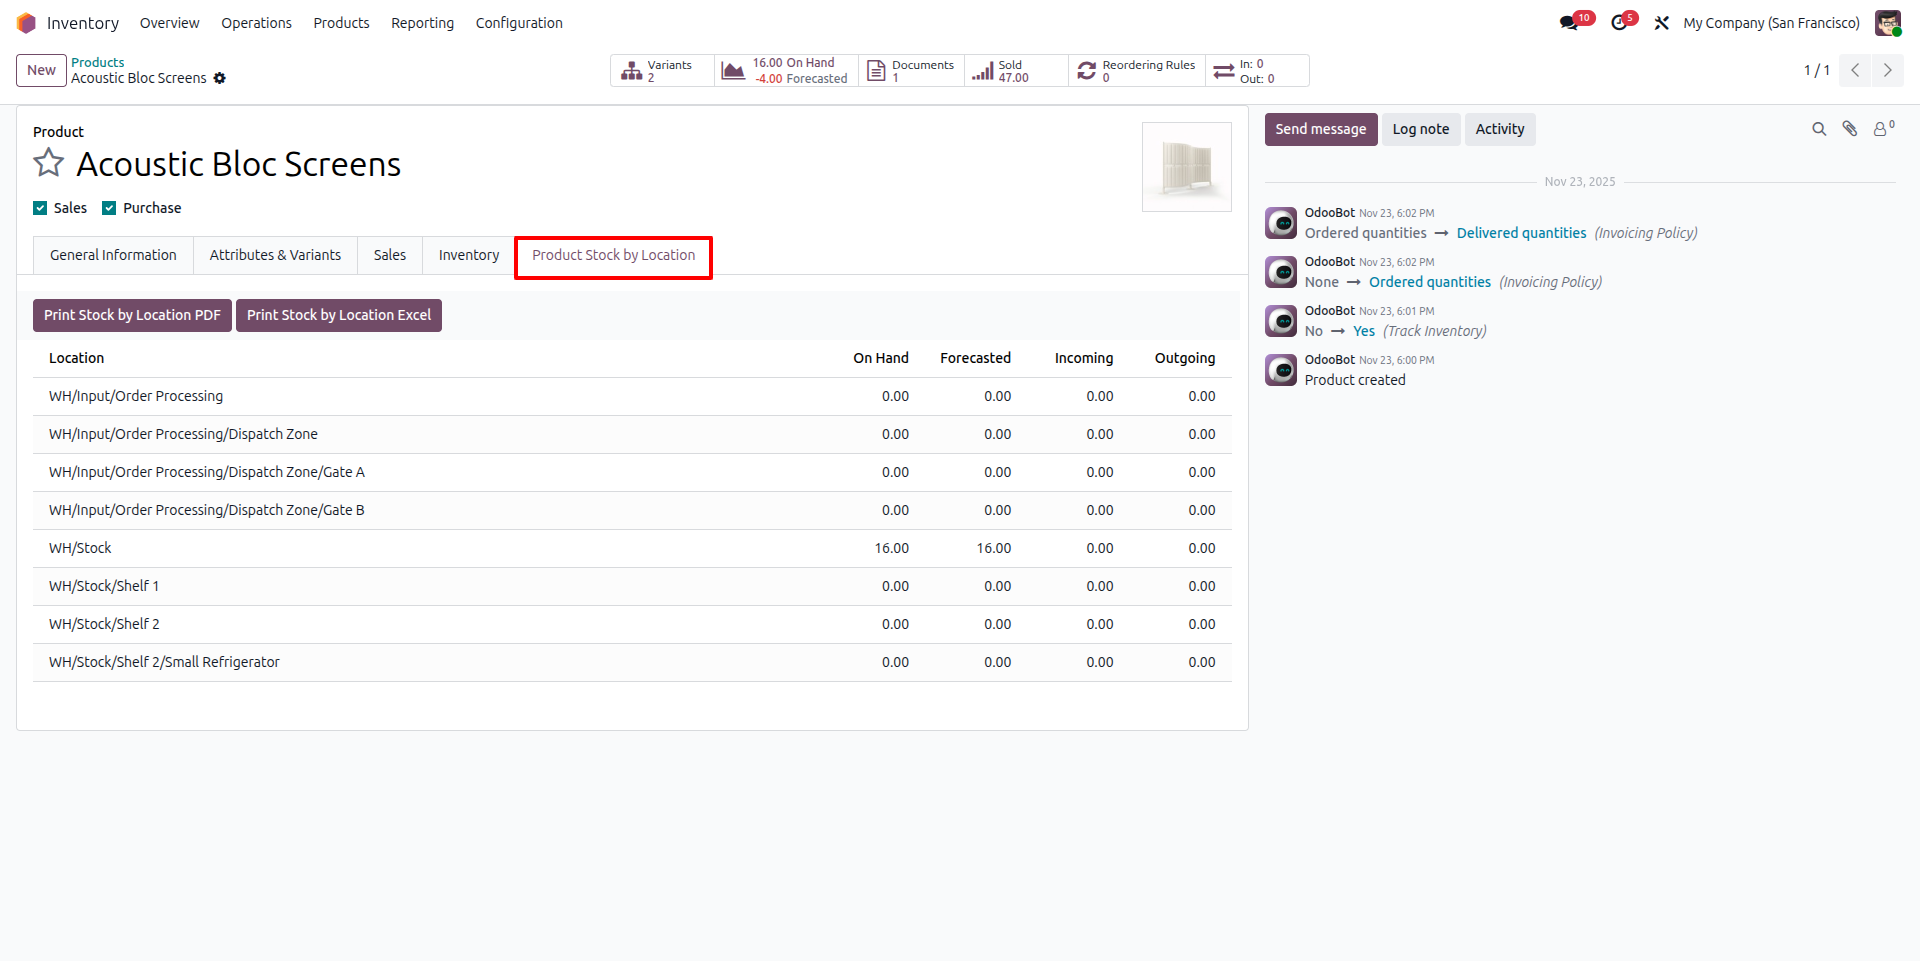
Product Stock by Location View
This view shows the Product Stock by Location tab, where users can check on-hand, forecasted, incoming, and outgoing quantities for each warehouse location. It also provides quick options to print the stock-by-location report in PDF or Excel format directly from the product form.
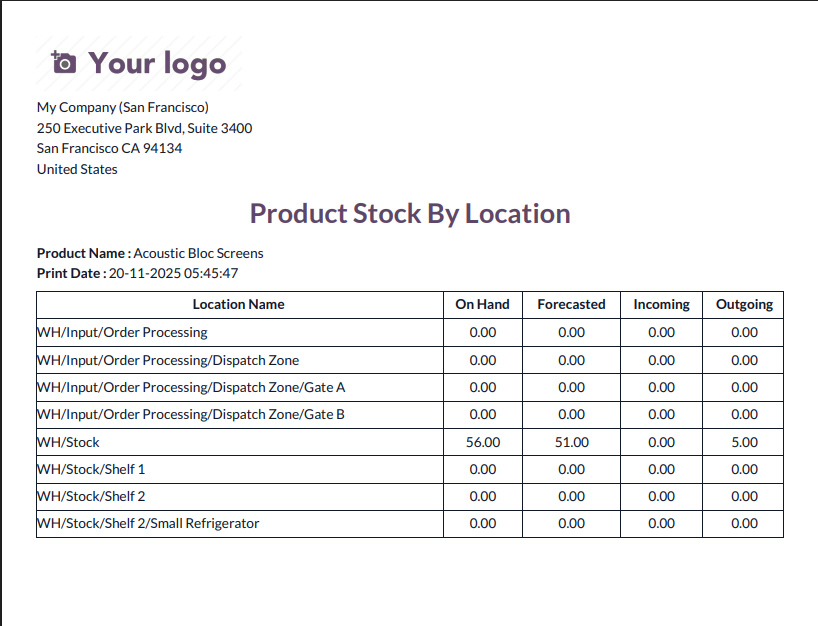
Product Stock By Location PDF Report
This PDF report provides a detailed breakdown of product quantities across each warehouse location. It shows on-hand, forecasted, incoming, and outgoing quantities, helping users understand stock distribution for a specific product at a glance.
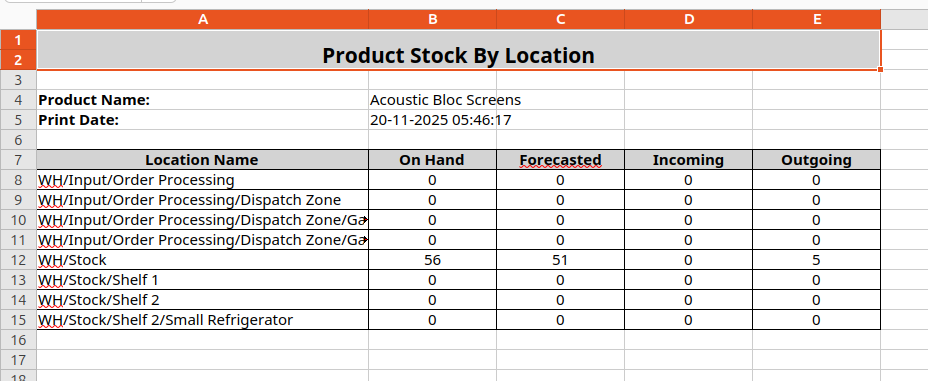
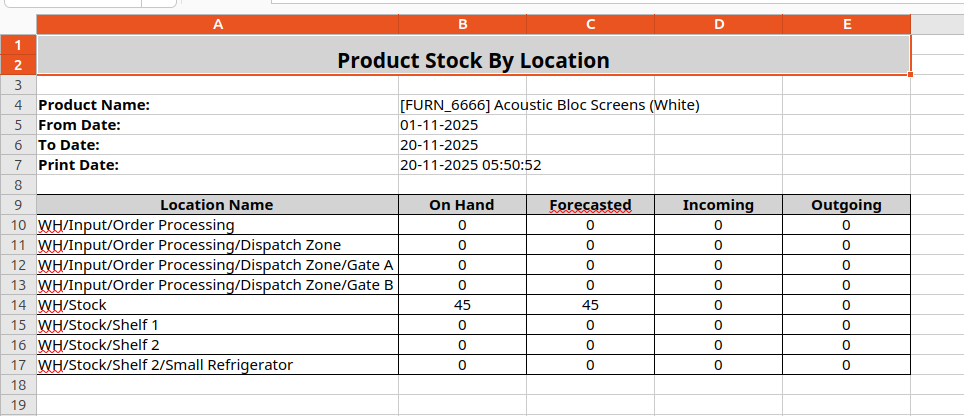
Product Stock By Location Excel Report
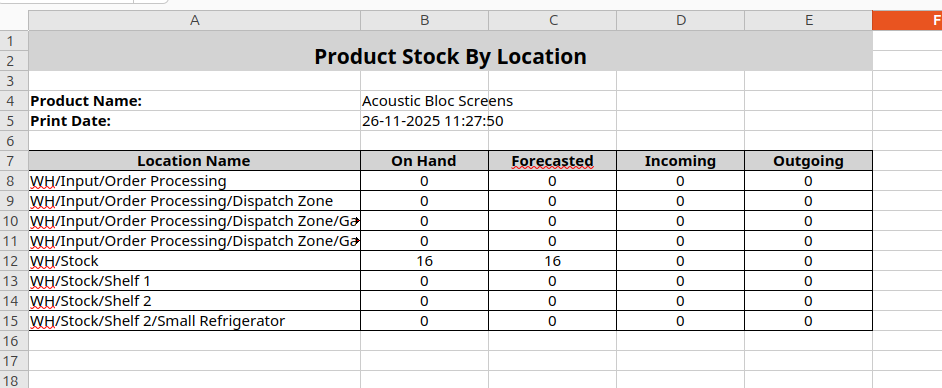
This Excel report shows product stock details across different warehouse locations, including on-hand quantity, forecasted quantity, incoming stock, and outgoing stock. It provides a clear, location-wise view of stock levels for the selected product.
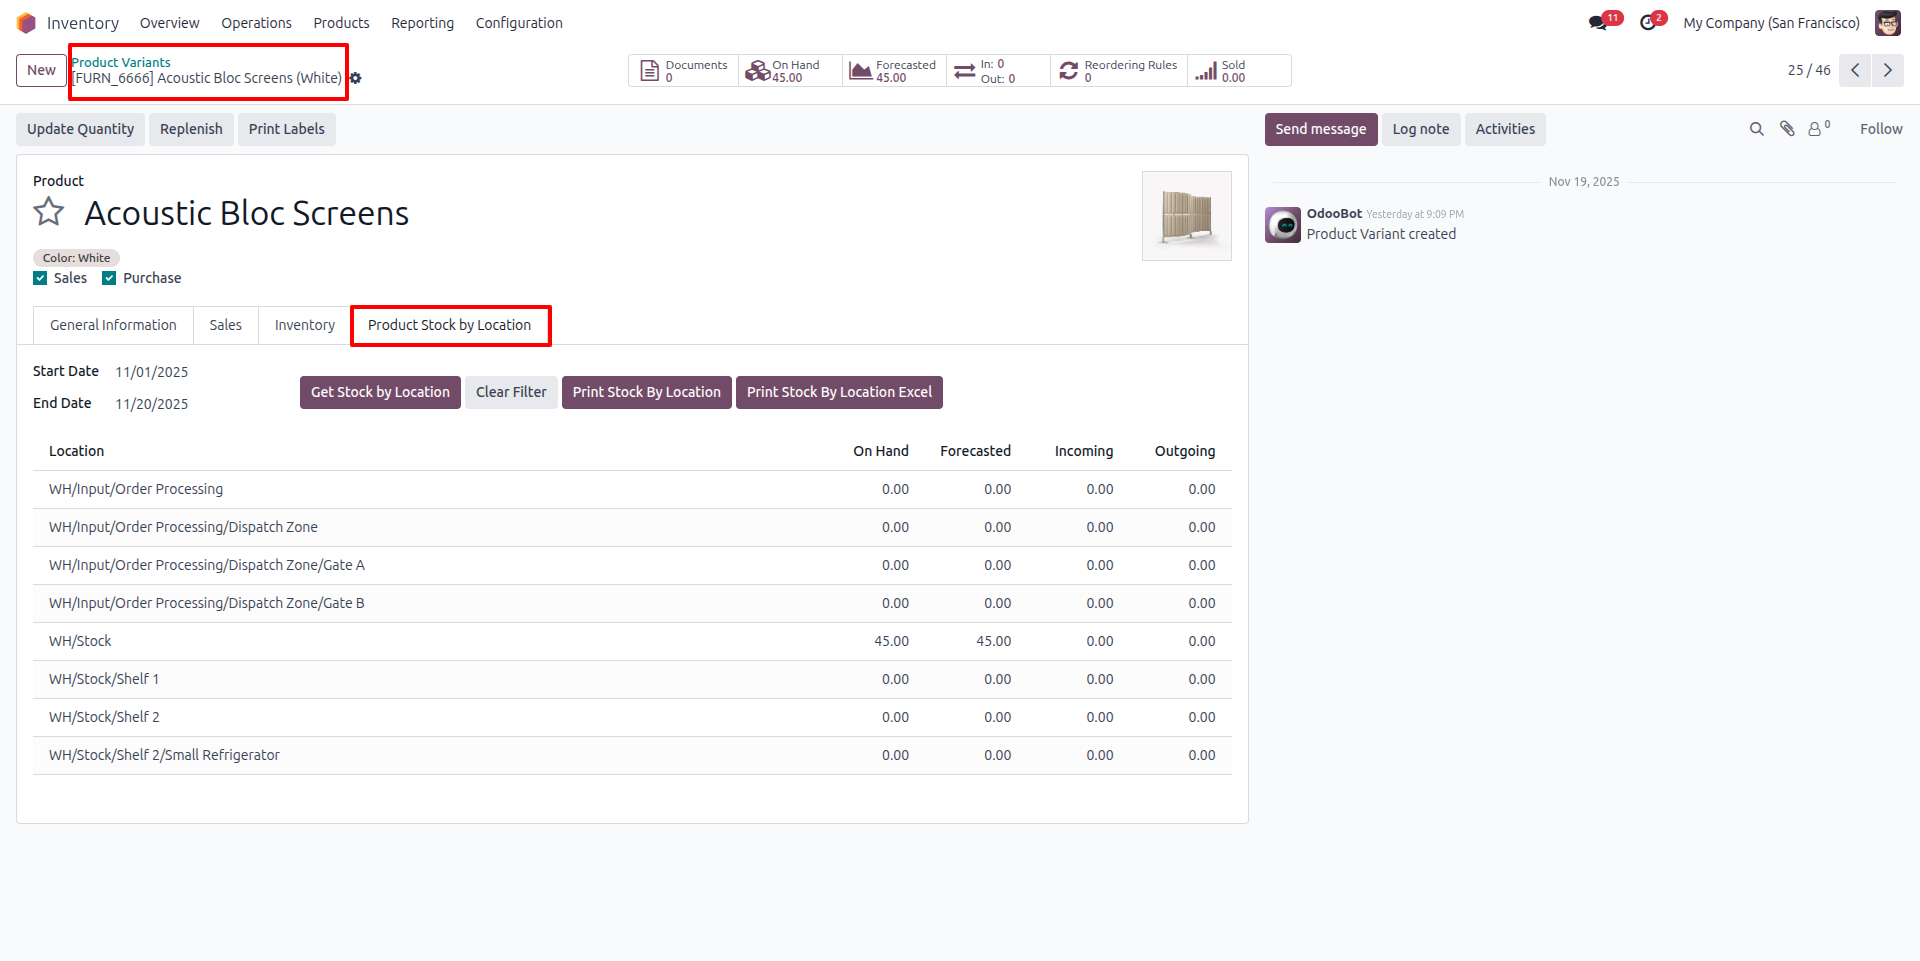
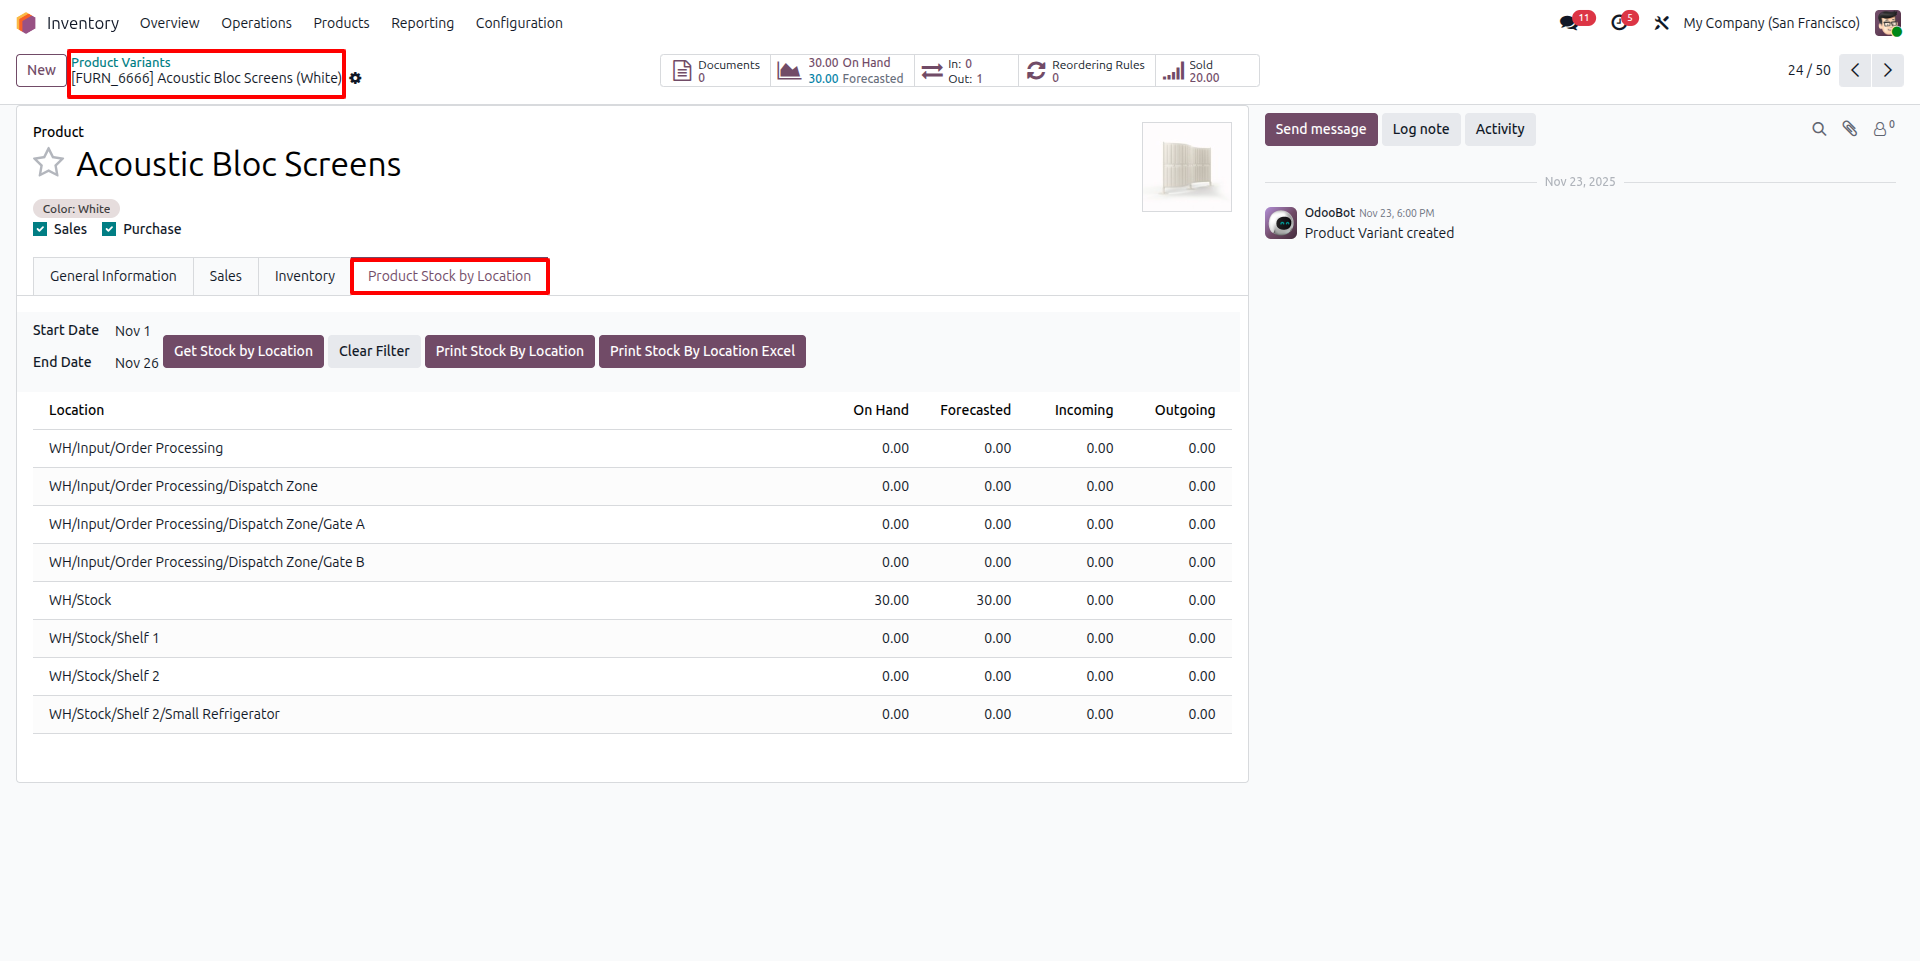
Product Variant Stock by Location View
This view shows the Stock by Location tab for a specific product variant, allowing users to filter by date range and check on-hand, forecasted, incoming, and outgoing quantities across all warehouse locations. It also includes options to get stock details and print the report in PDF or Excel format.
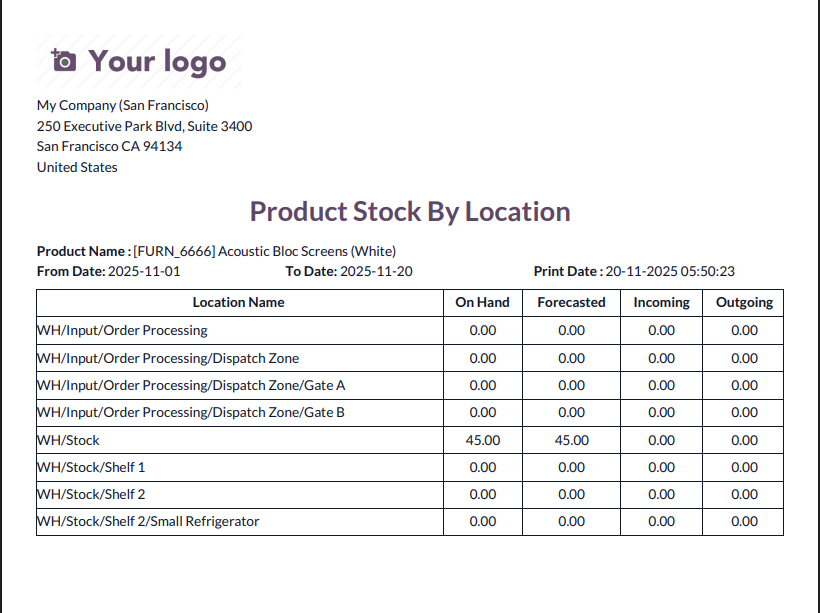
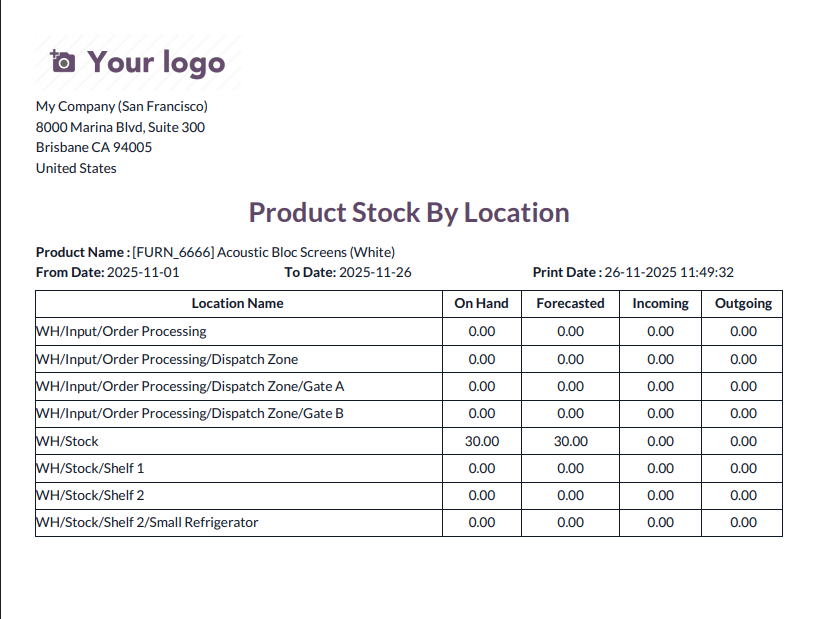
Product Variant Stock By Location PDF Report
This PDF report provides location-wise stock details for a specific product variant, showing on-hand, forecasted, incoming, and outgoing quantities within the selected date range. It helps users understand stock distribution for the chosen variant across all warehouse locations.
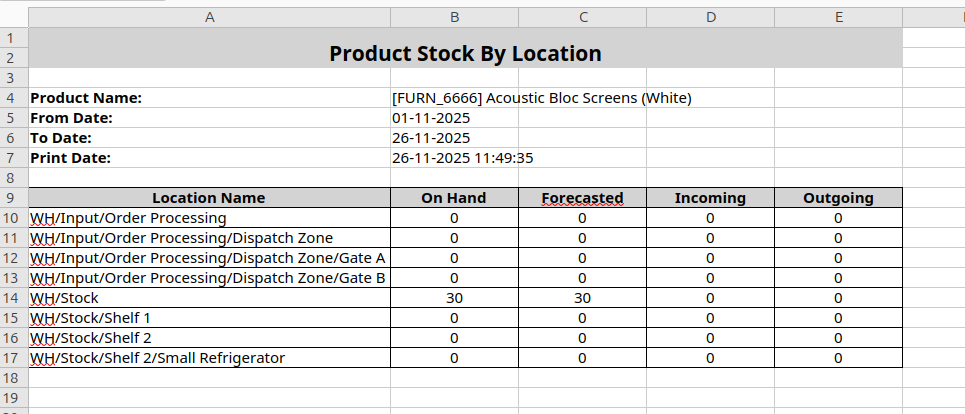
Product Variant Stock By Location Excel Report
This Excel report provides a detailed location-wise stock summary for a specific product variant. It includes on-hand, forecasted, incoming, and outgoing quantities, allowing users to quickly review stock levels across all warehouse locations for the selected date range.
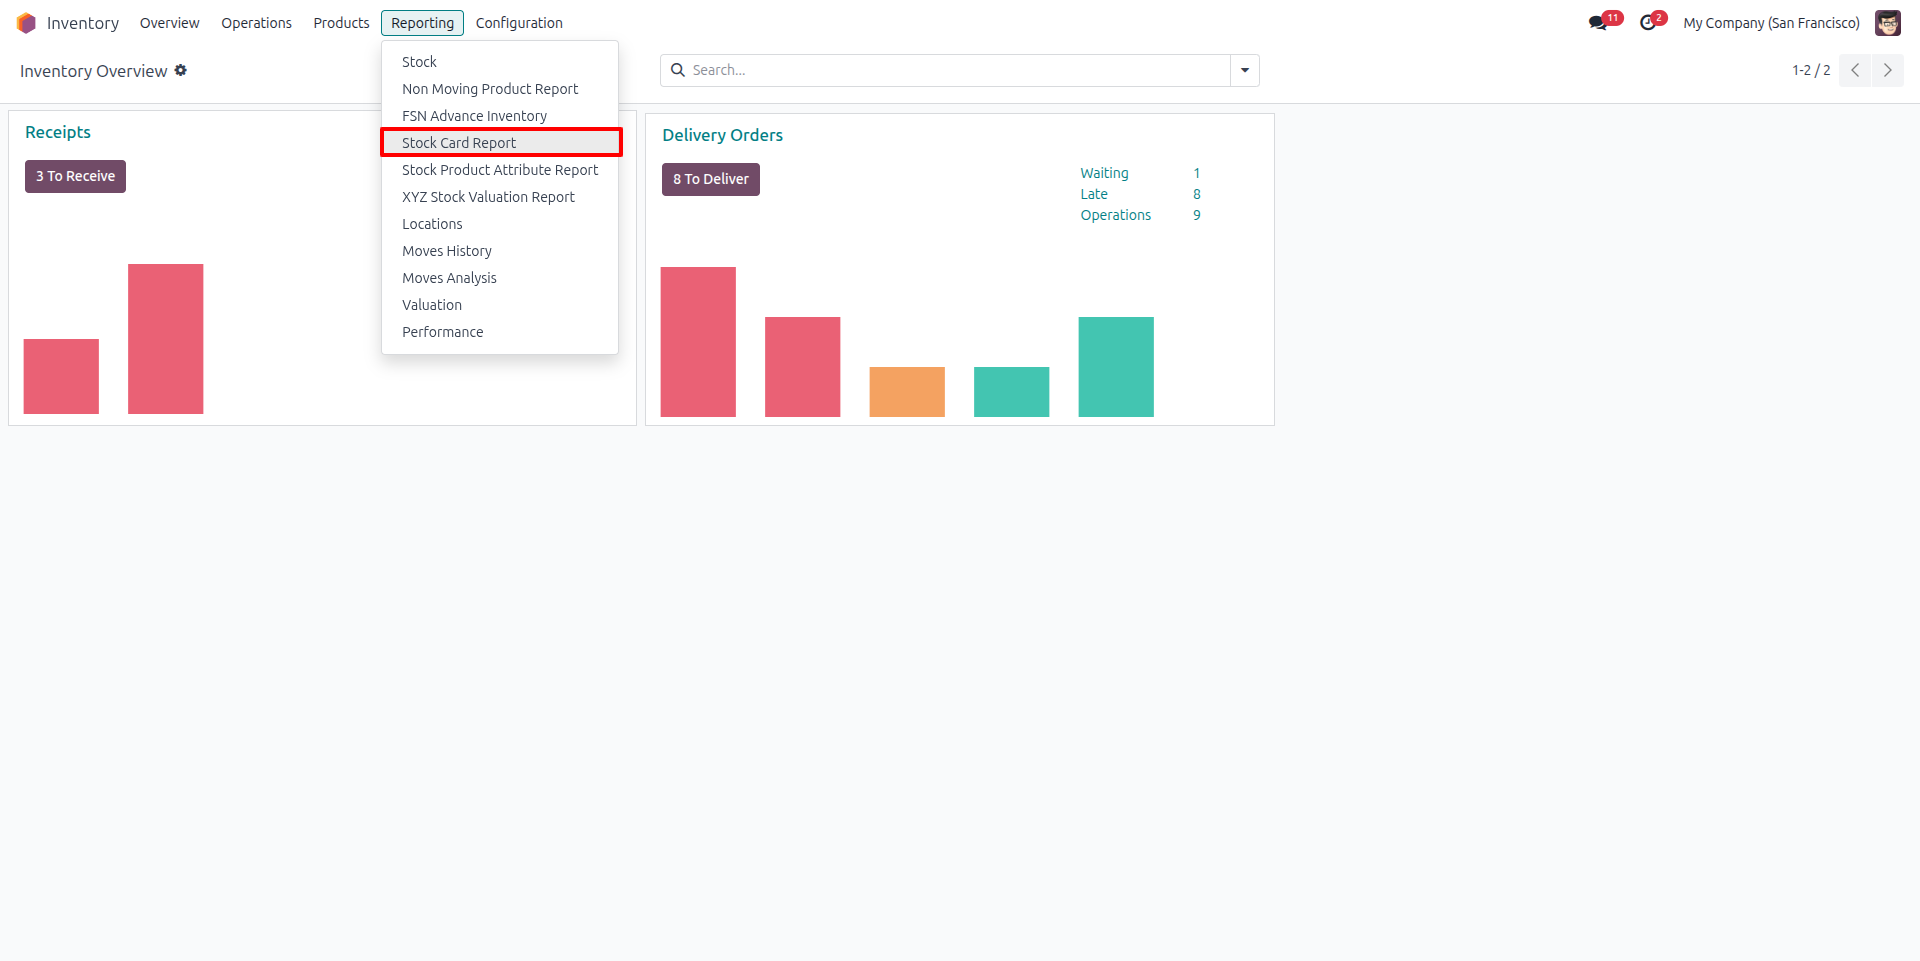
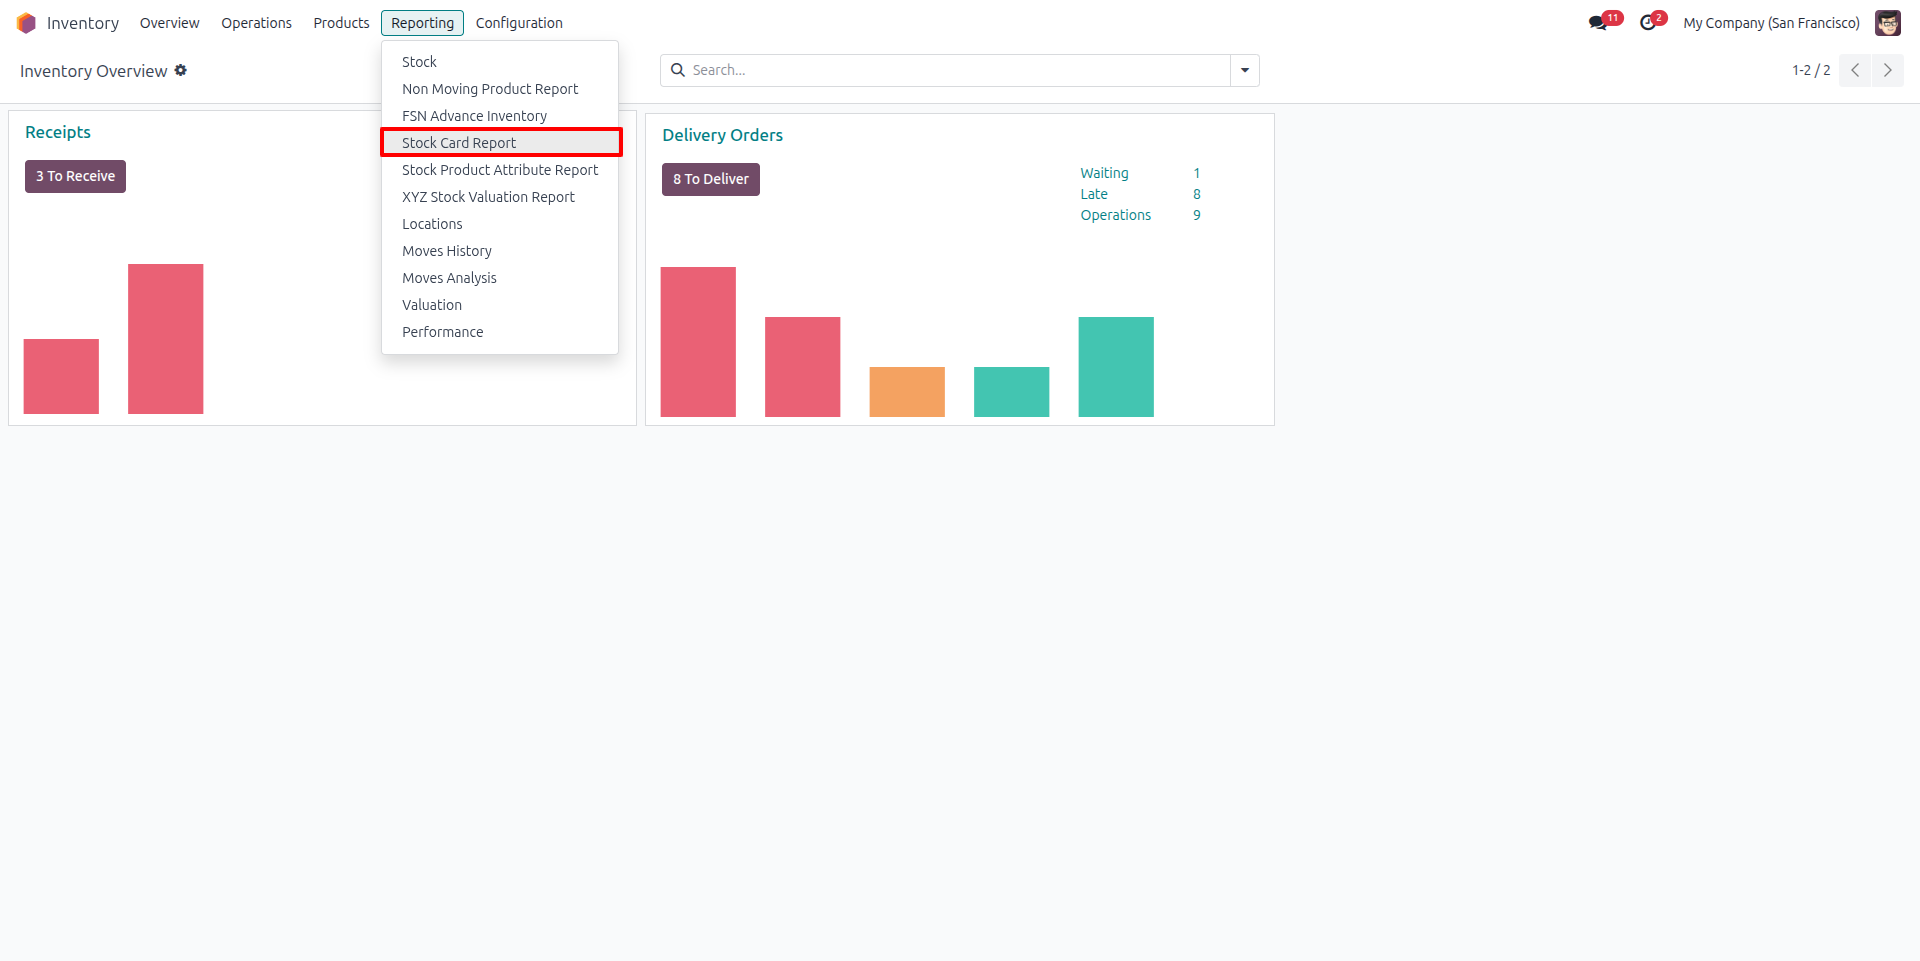
Stock Card Report Menu Access
This image shows the Reporting menu in the Inventory module, where the new “Stock Card Report” option is available. Users can open this report directly from the dropdown to view detailed product movement history within a selected date range.
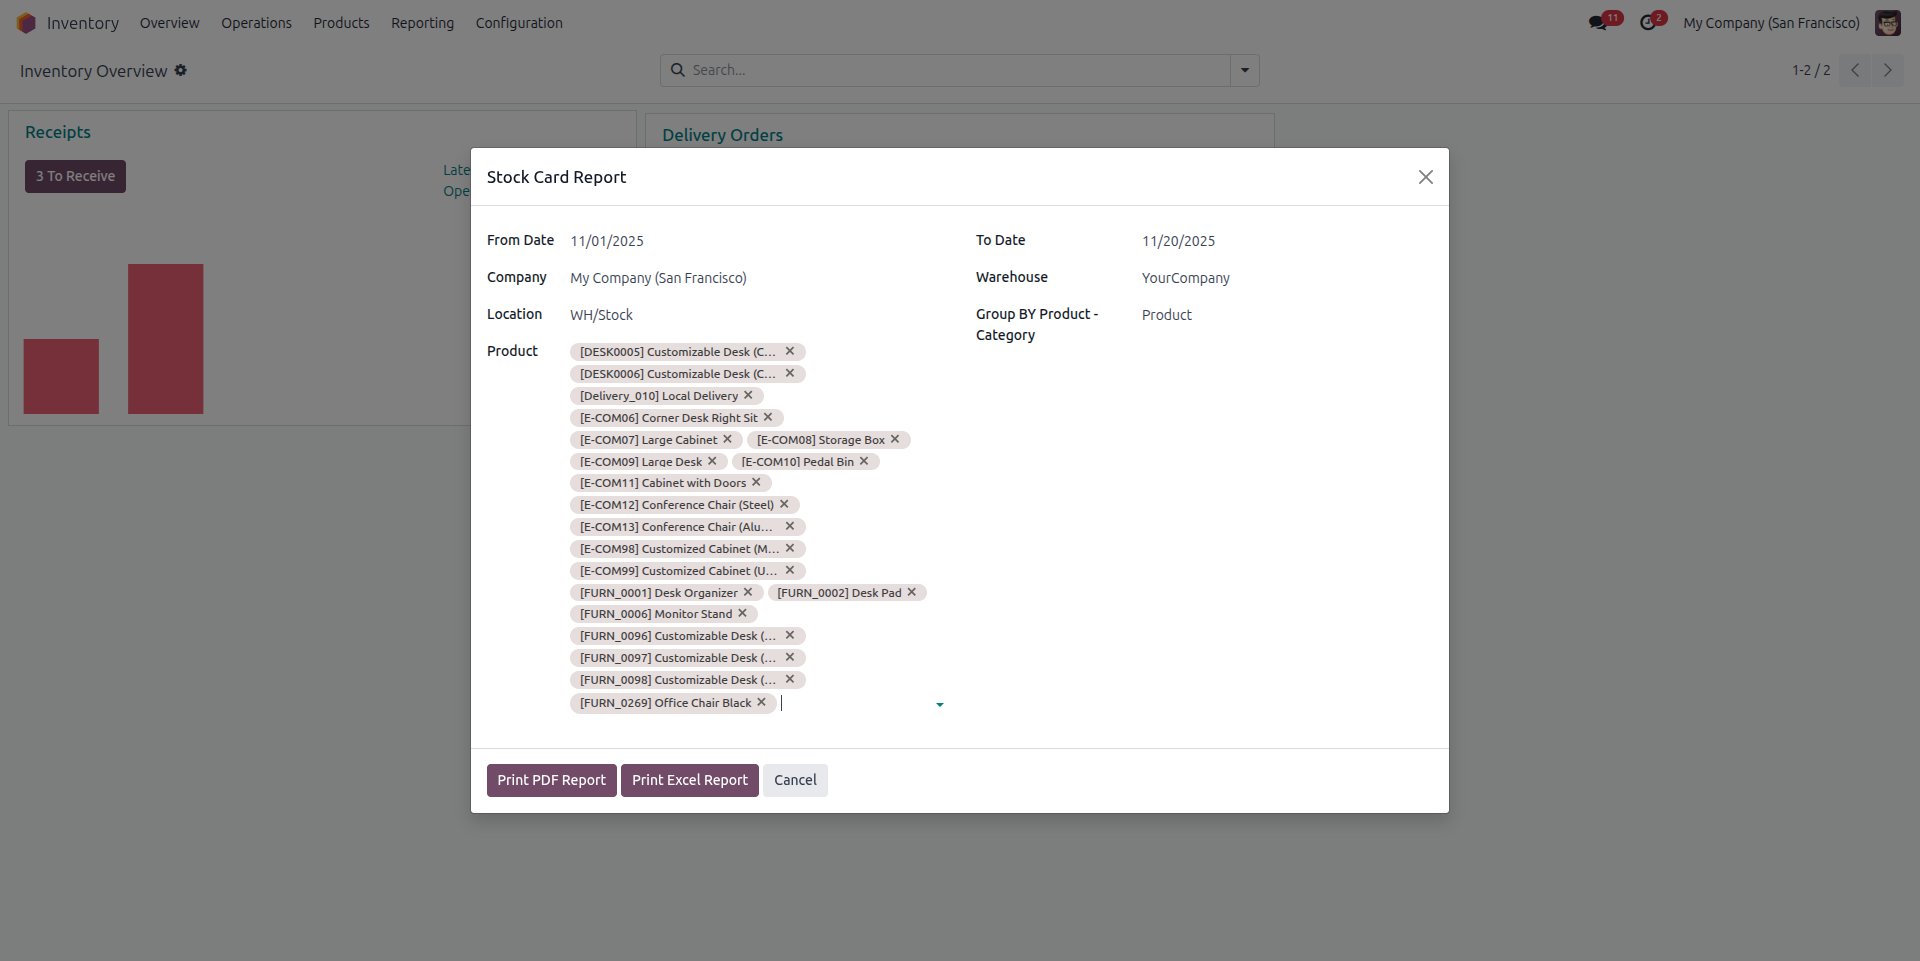
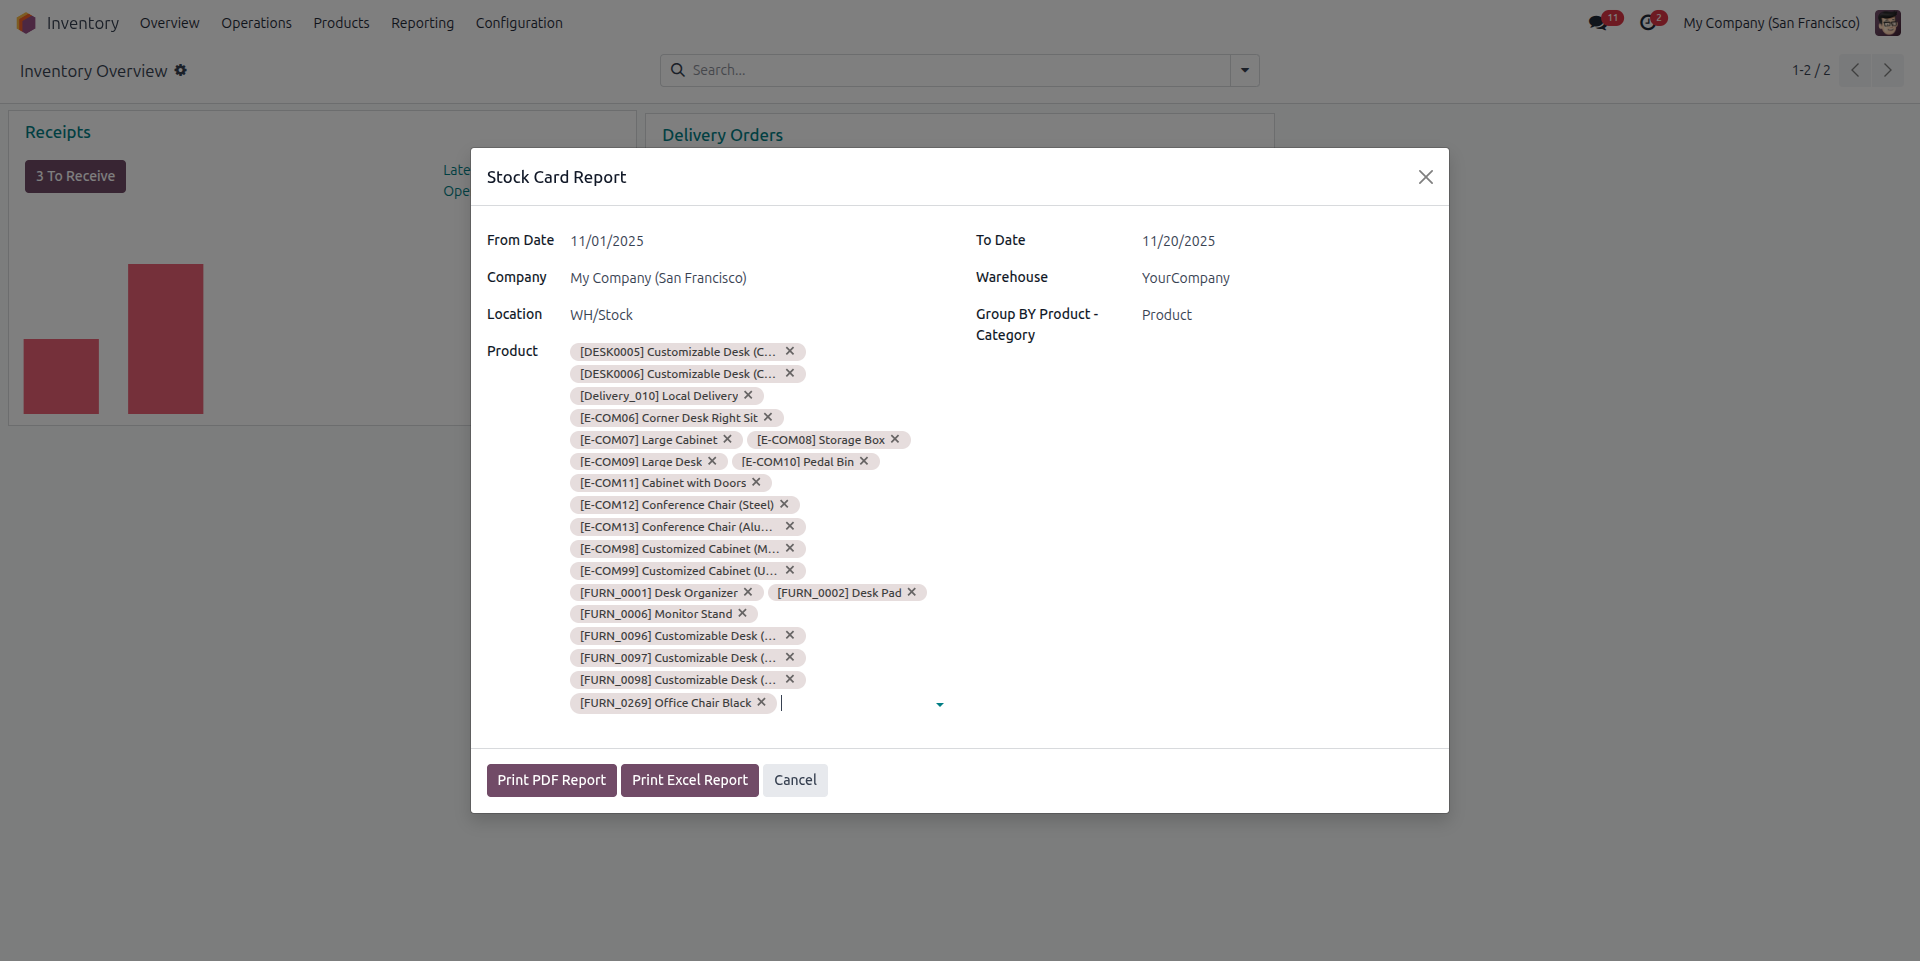
Stock Card Report Wizard
The Stock Card Report wizard allows users to select a date range, company, warehouse, location, and specific products to generate detailed stock movement records. It also provides an option to group results by product or category and export the report in PDF or Excel format.
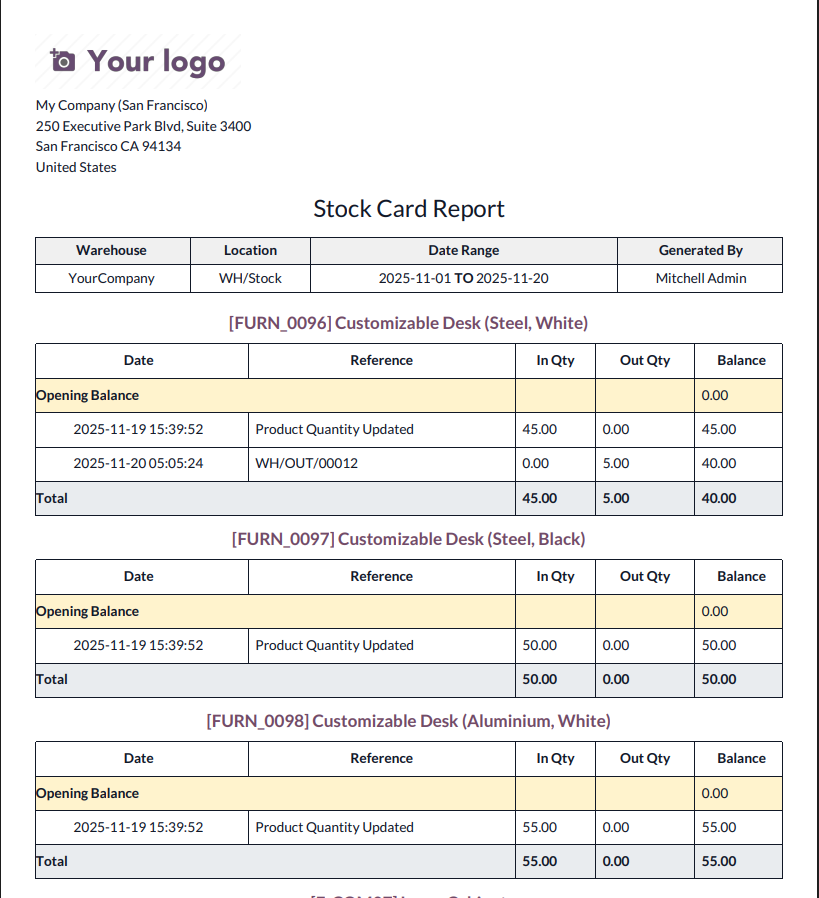
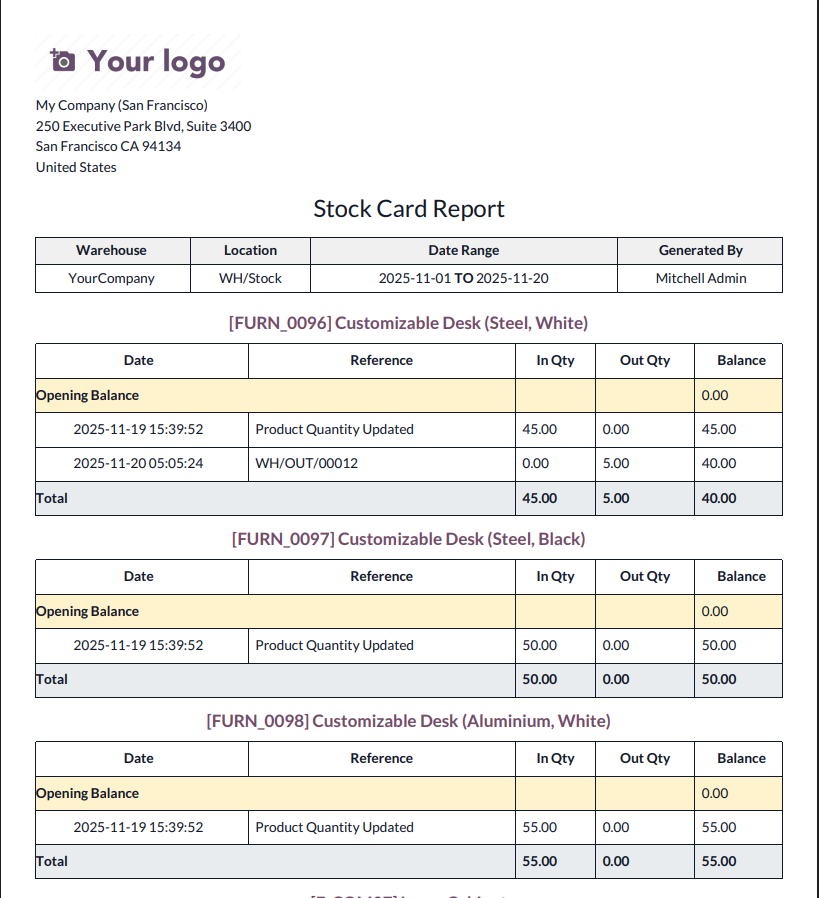
Stock Card PDF Report
This PDF report provides a complete history of stock movements for each selected product within the chosen date range. It includes opening balance, incoming quantities, outgoing quantities, references, and running balance, helping users track product-level stock activity in detail.
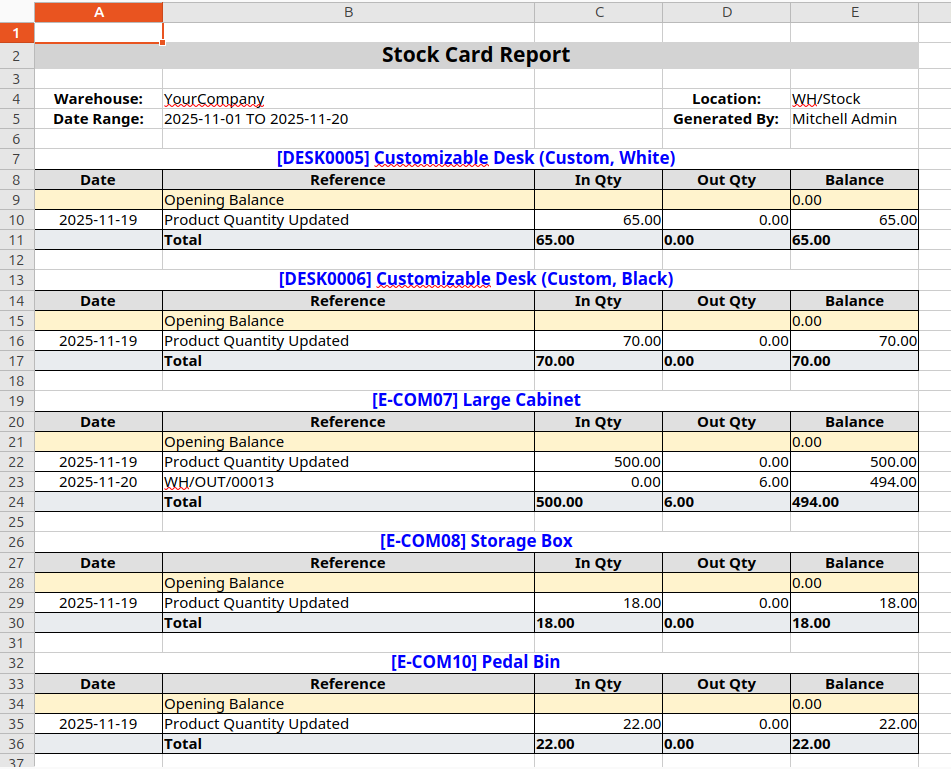
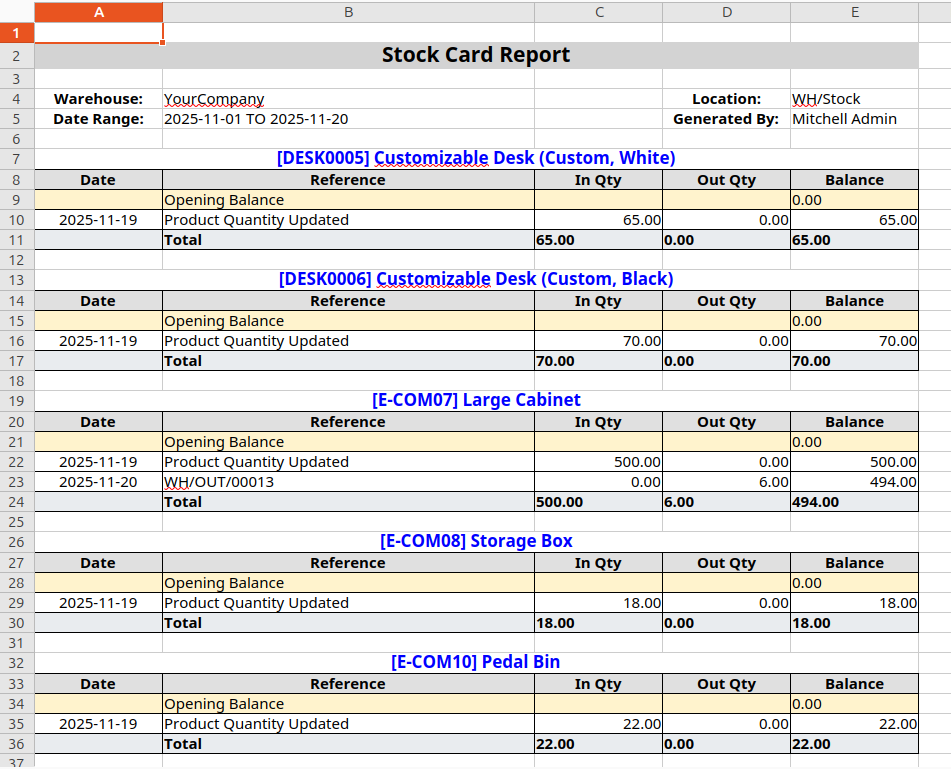
Stock Card Excel Report
This Excel report provides a detailed product-wise stock movement summary, including opening balance, incoming quantities, outgoing quantities, references, and running balance for each product. It helps users easily review stock activity across the selected date range in a clear tabular format.
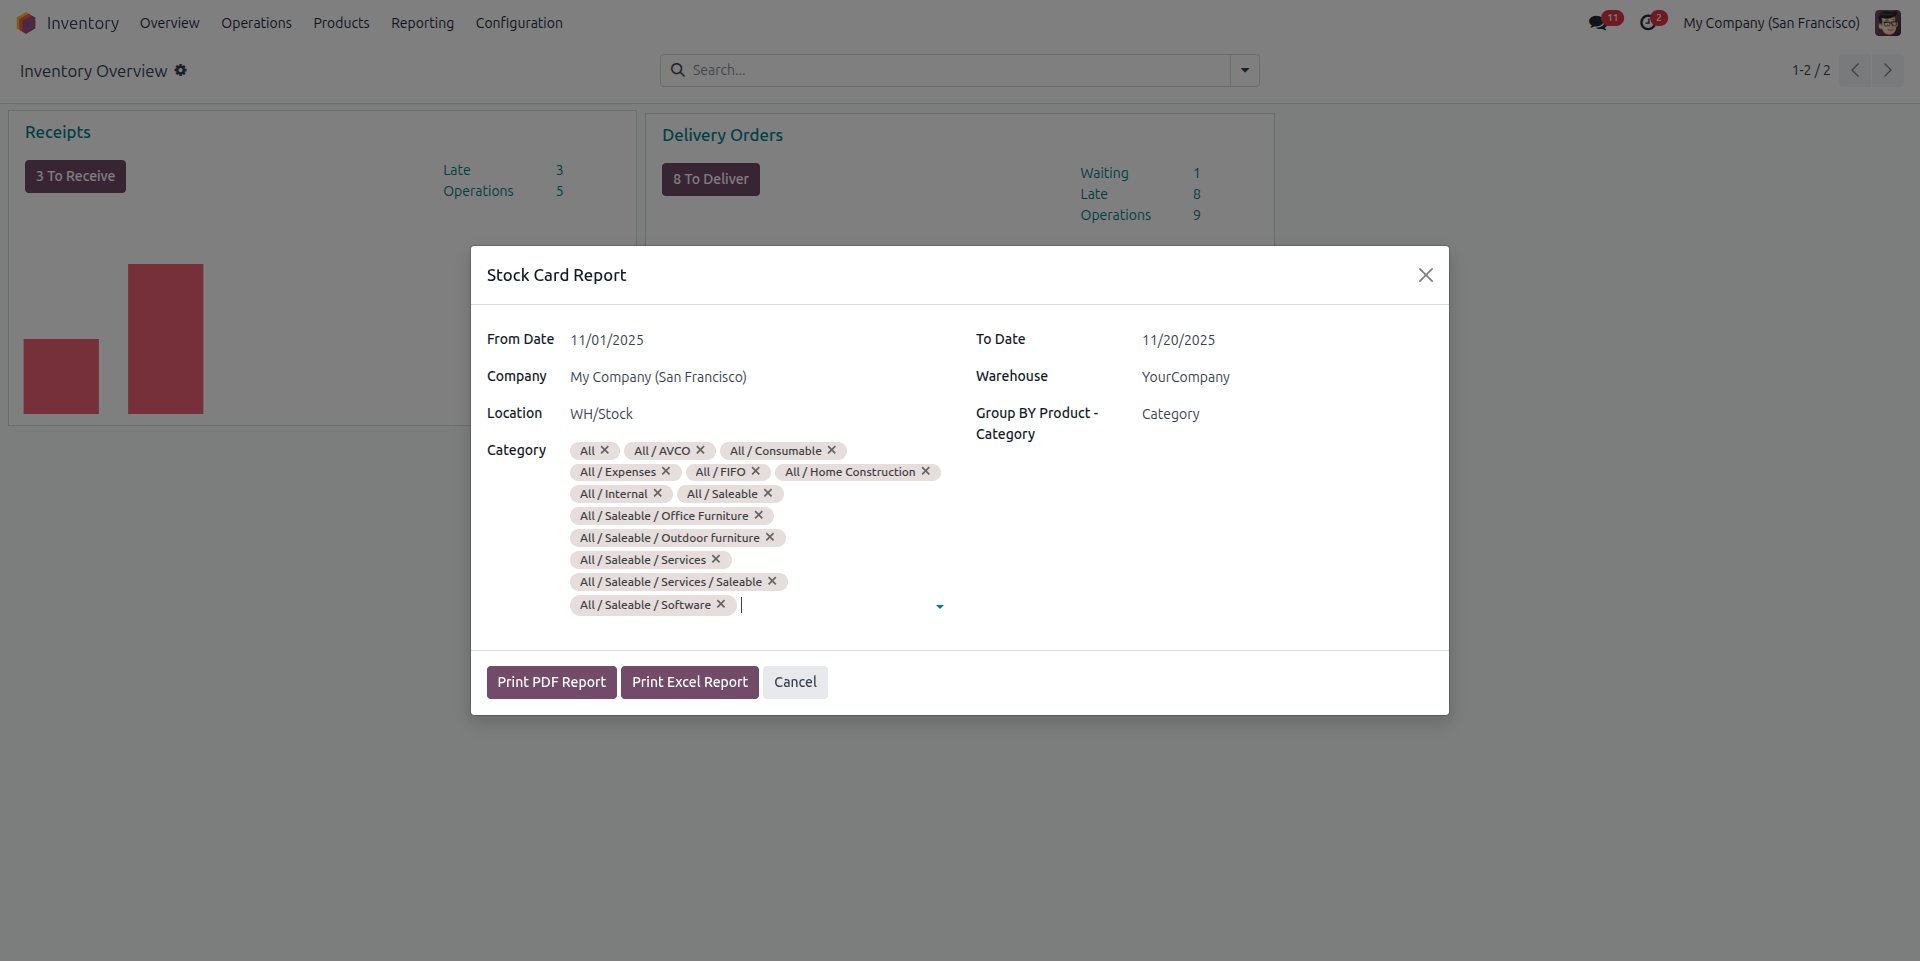
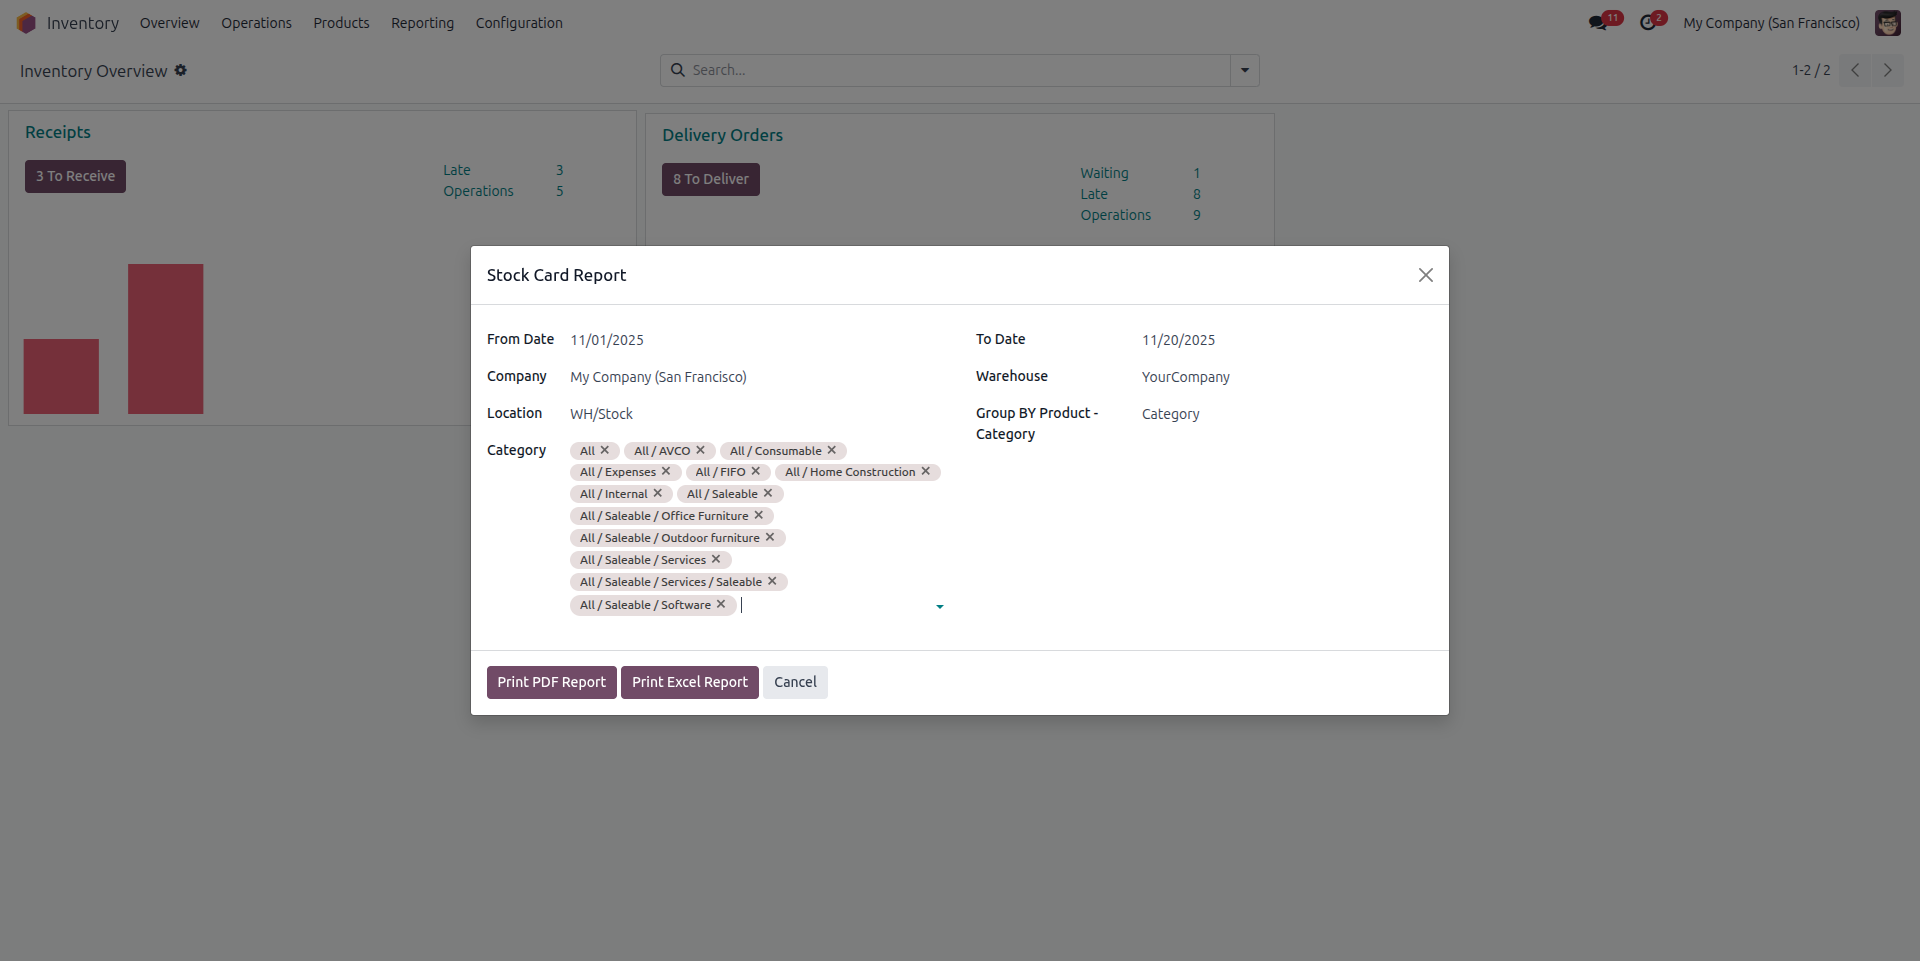
Stock Card Report Category Filter Wizard
This wizard allows users to generate a category-wise Stock Card Report by selecting a date range, company, warehouse, location, and multiple product categories. It also includes an option to group results by category and export the report in PDF or Excel format.
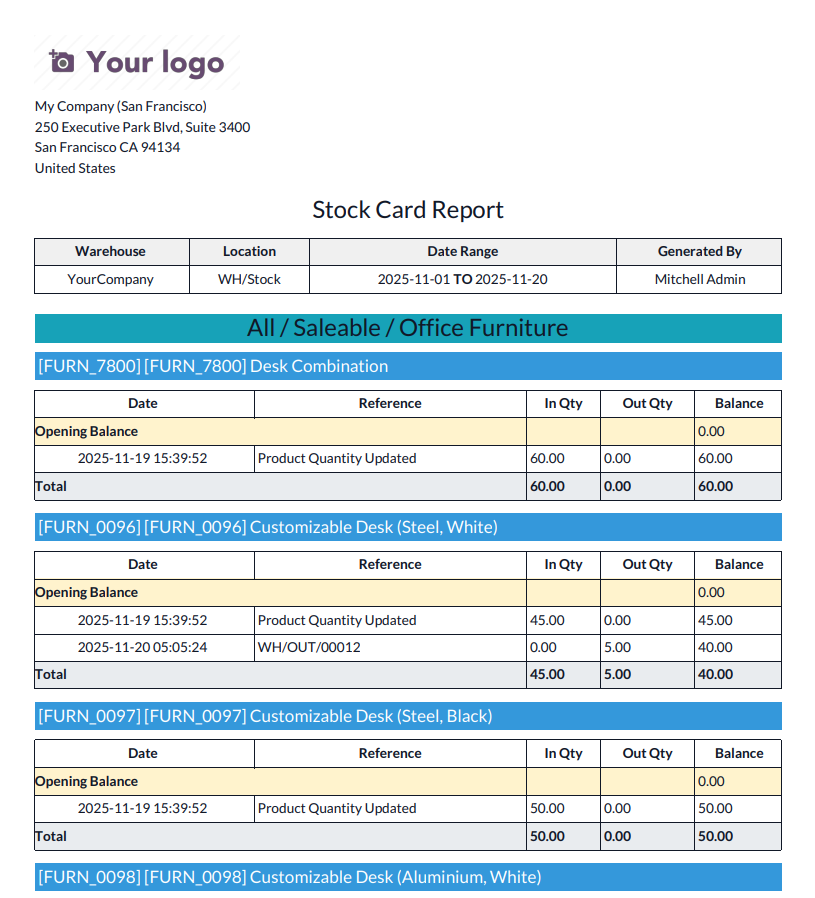
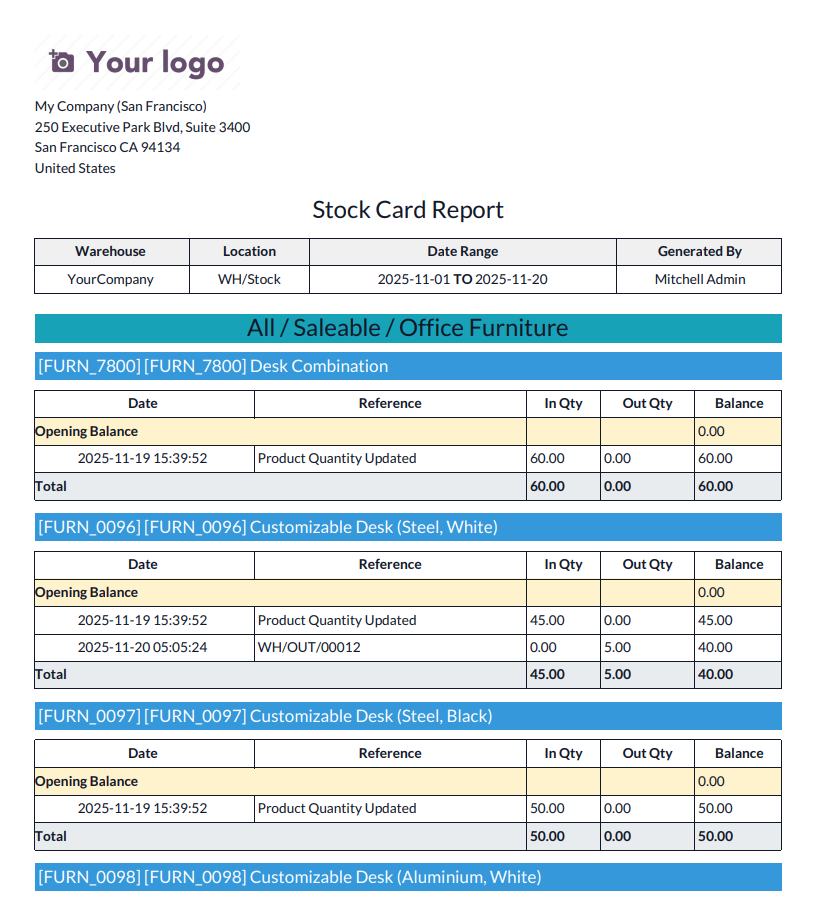
Stock Card Report - Category Wise PDF Report
This PDF report presents a category-wise stock movement summary, grouping products under selected categories. It includes opening balance, incoming quantities, outgoing quantities, references, and running balance for each product, helping users analyze stock activity across specific product categories.
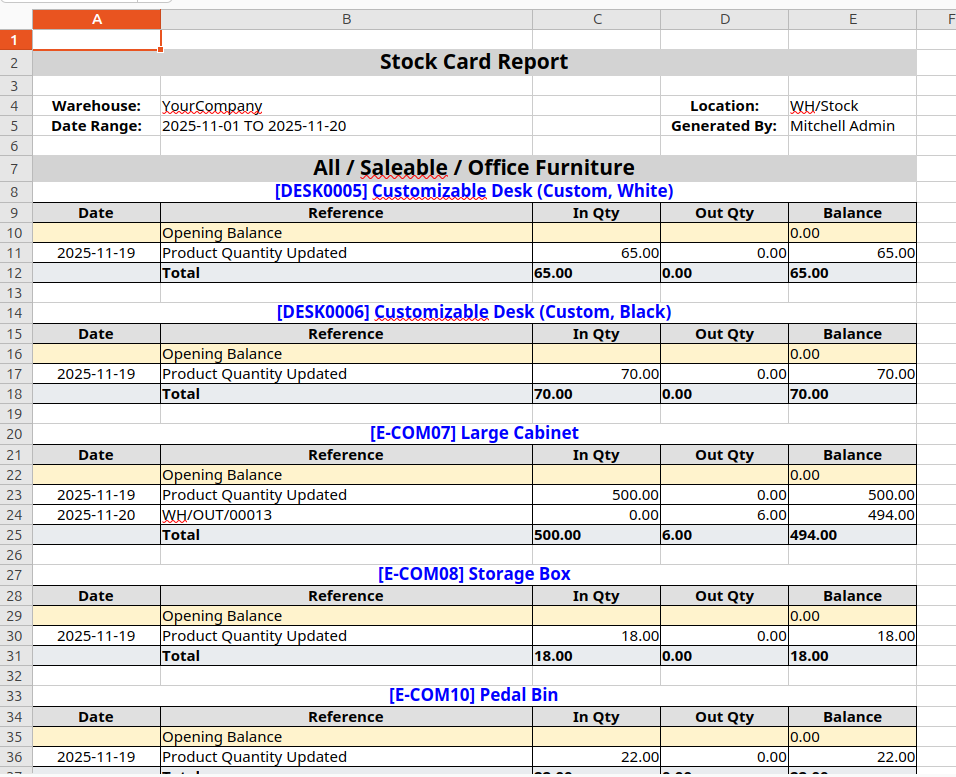
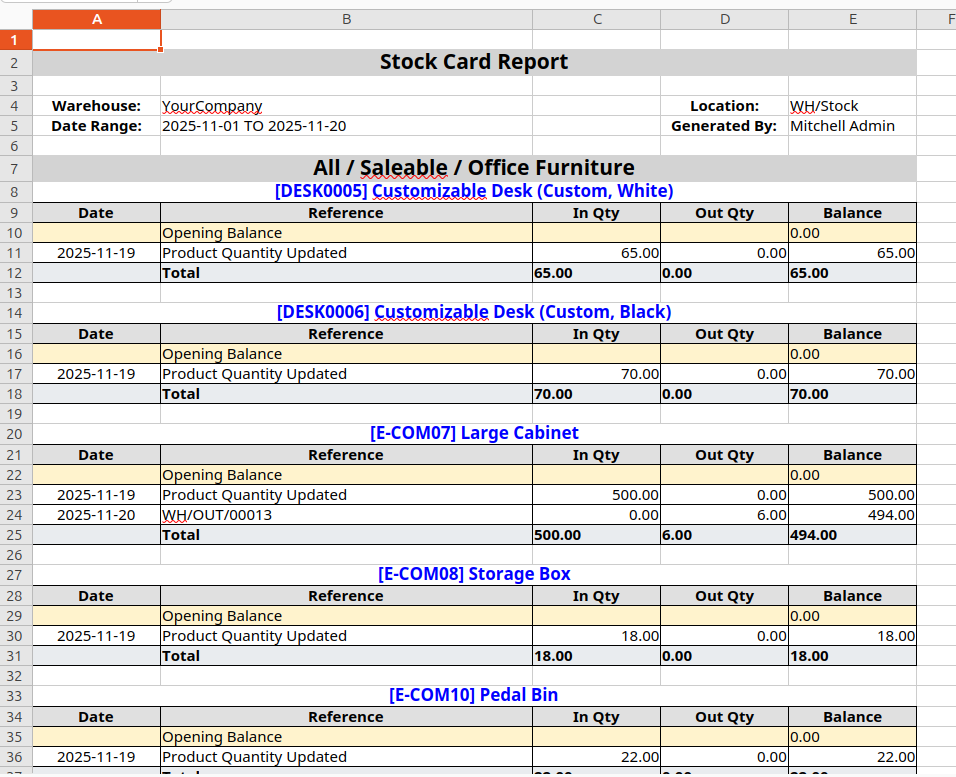
Stock Card Report - Category Wise Excel Report
This Excel report shows category-wise stock movement details for selected products, including opening balance, incoming quantities, outgoing quantities, references, and running balance. It helps users analyze stock activity within specific product categories over the selected date range.
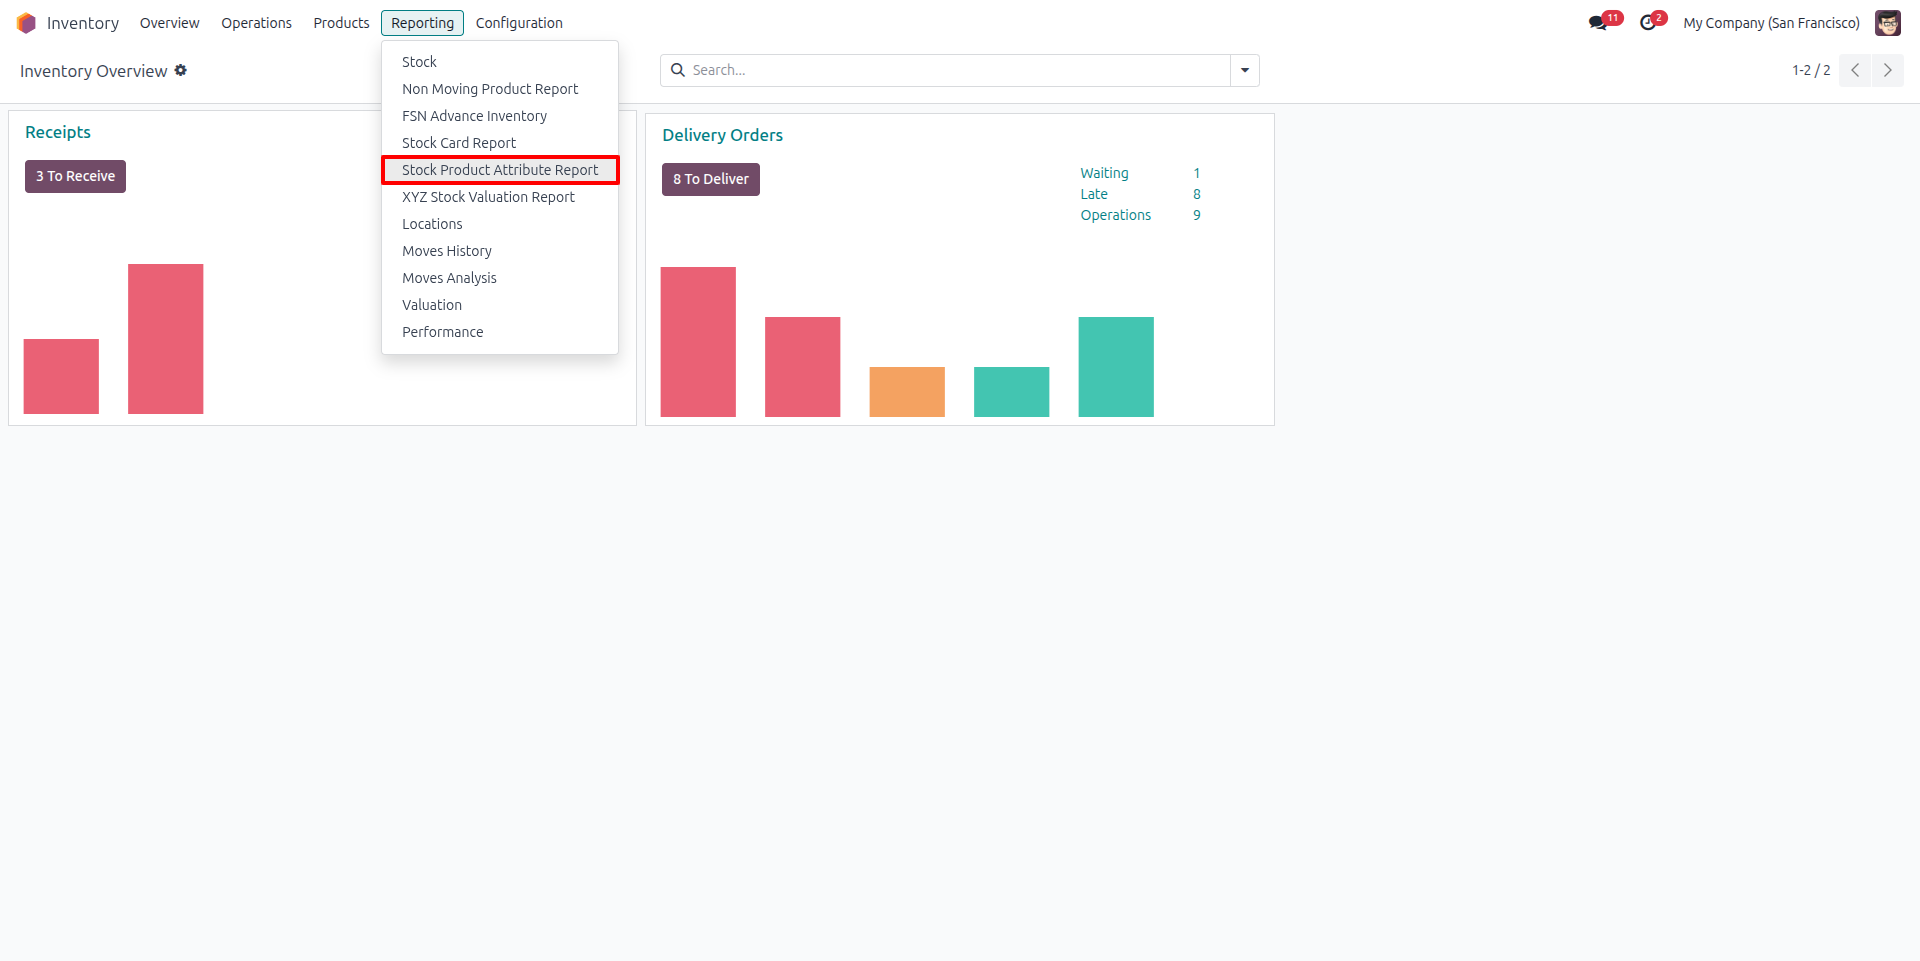
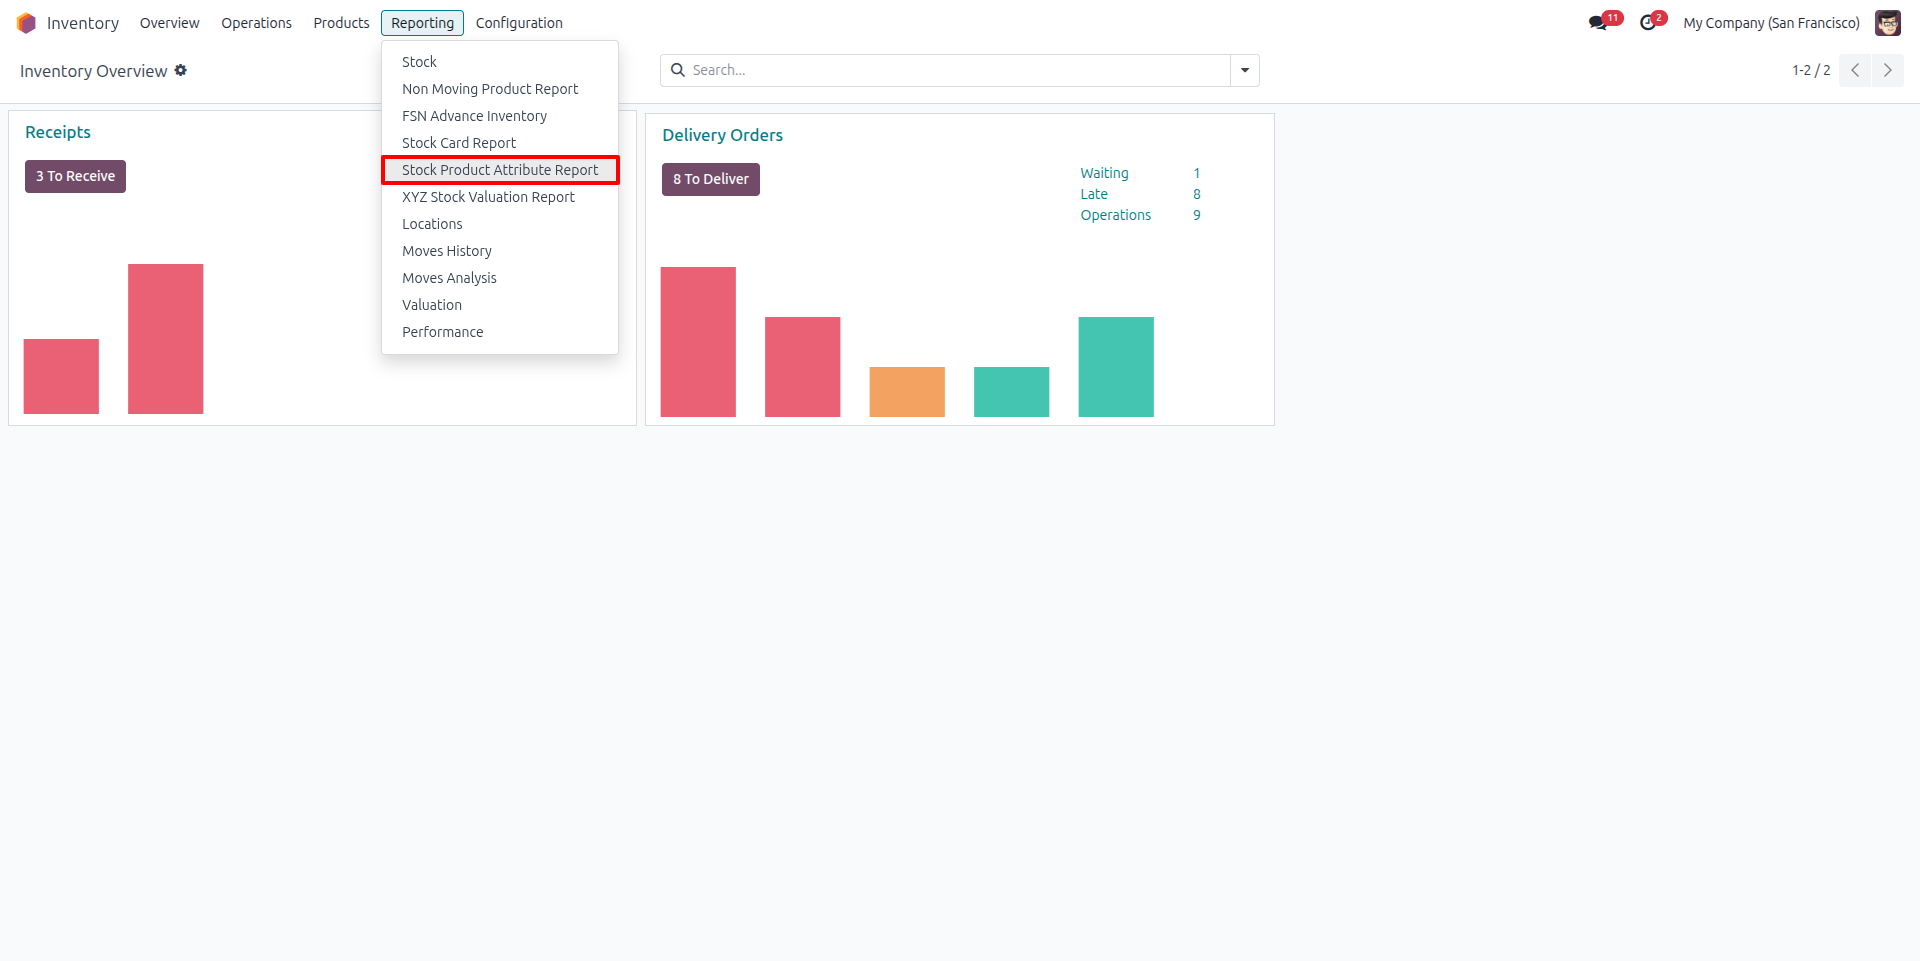
Stock Product Attribute Report Menu Access
This image displays the Inventory → Reporting dropdown menu where the “Stock Product Attribute Report” option is available. Users can access this report directly from the reporting section to analyze product-wise stock quantities categorized by attributes such as size, color, and variant.
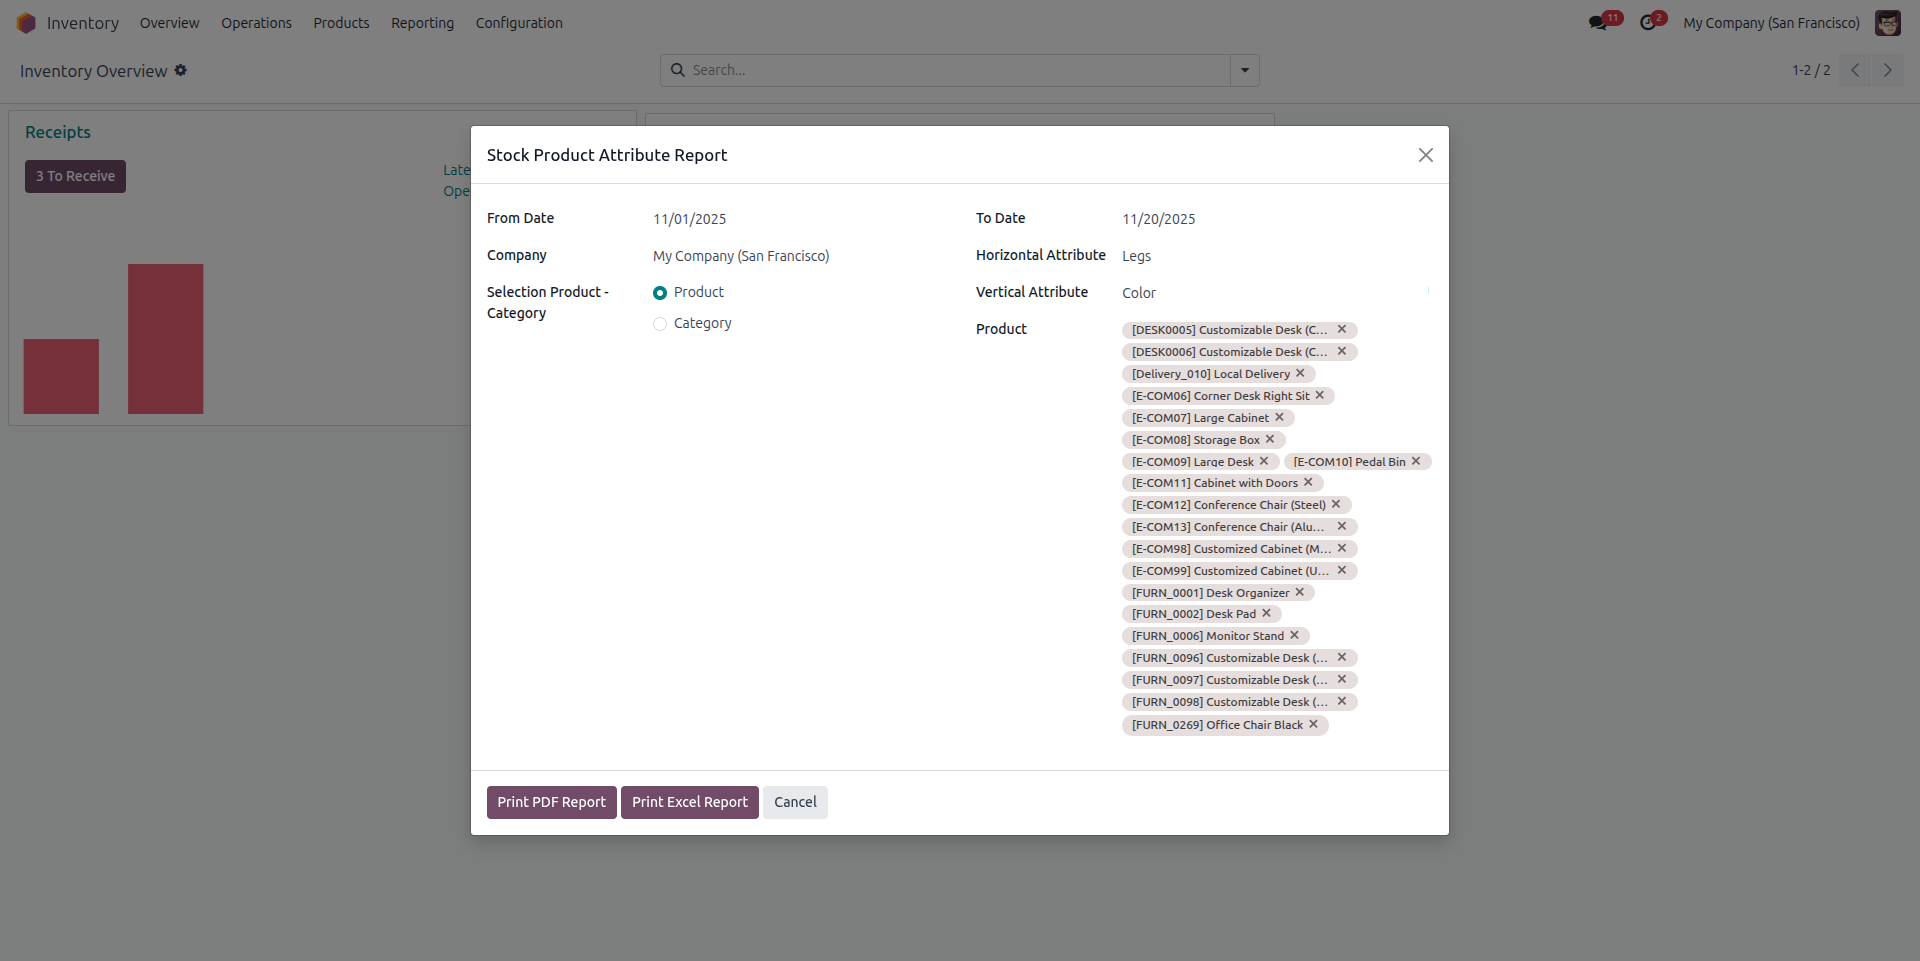
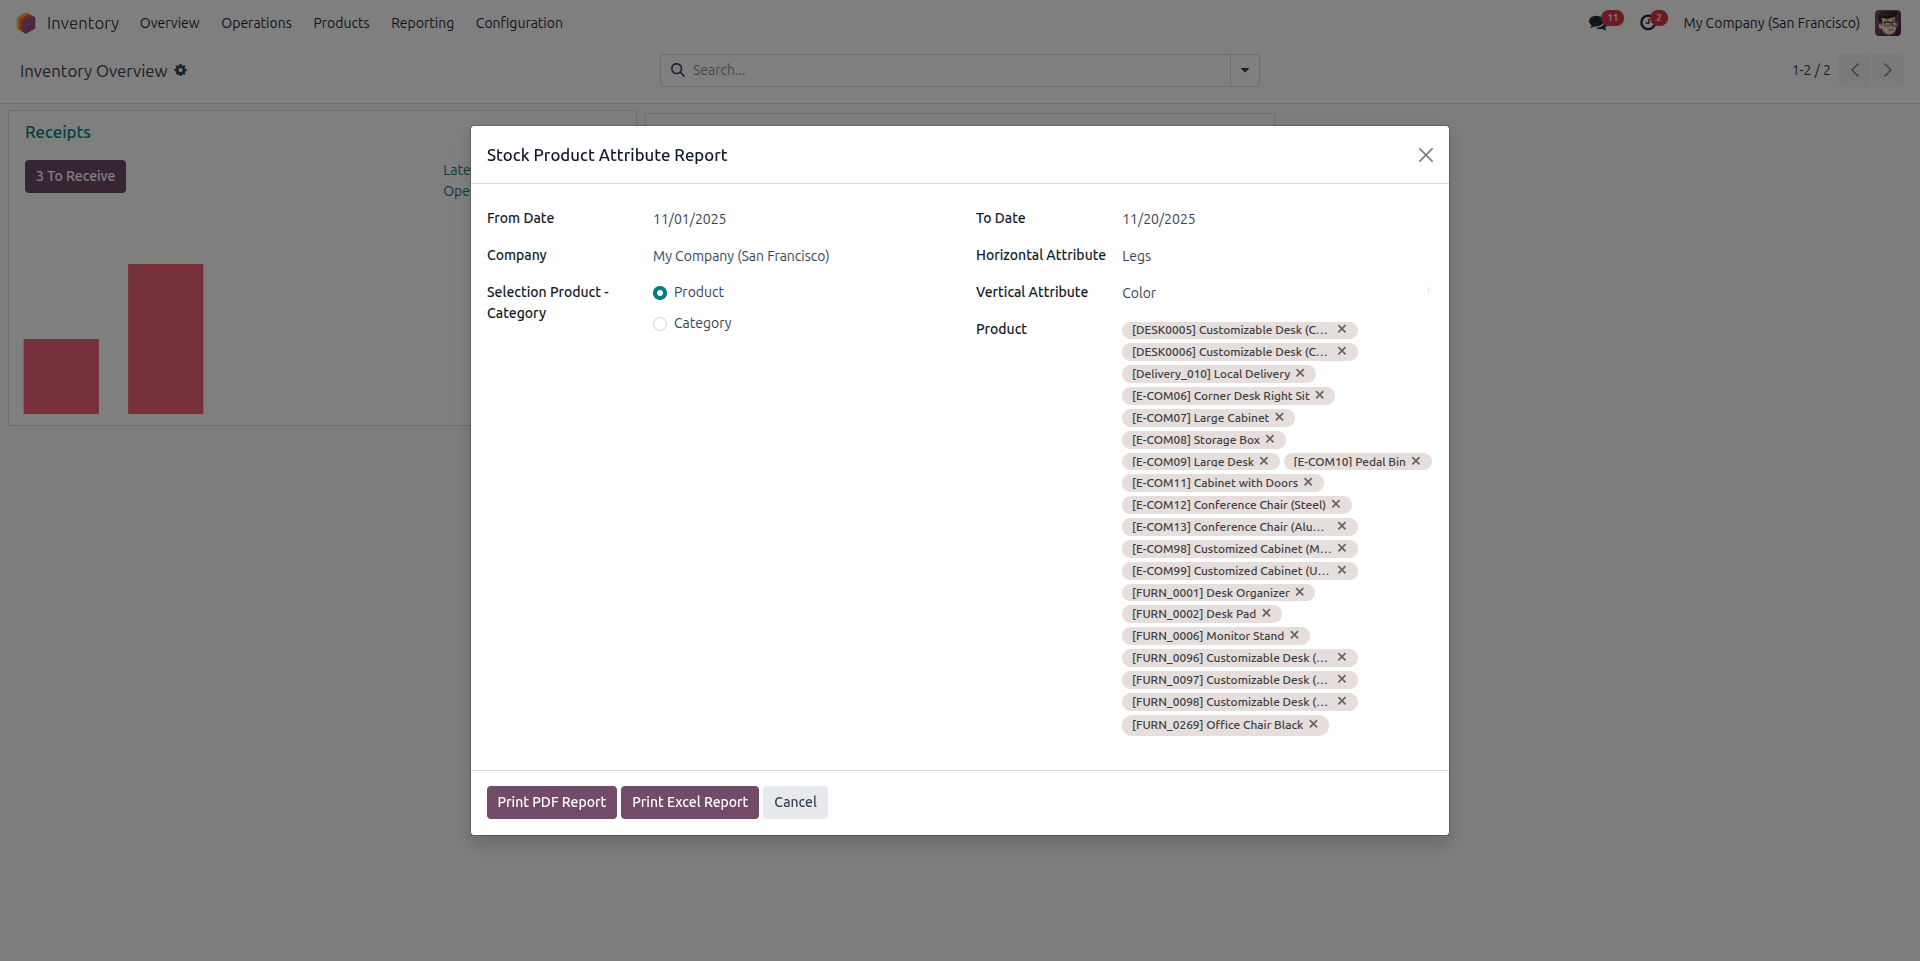
Stock Product Attribute Report Wizard
This screen displays the Stock Product Attribute Report wizard, where users can select a date range, choose between product or category-based filtering, and define horizontal and vertical attributes (such as Legs and Color). Users can also select specific products and generate the report in PDF or Excel formats.
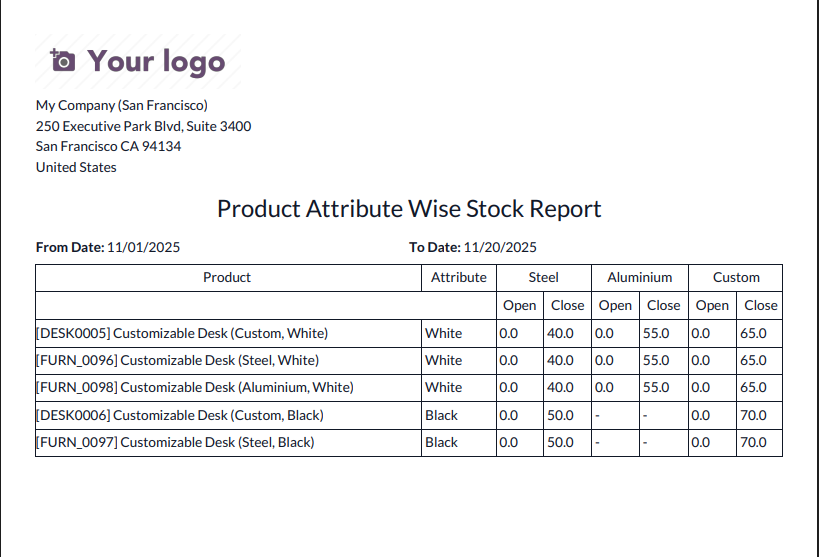
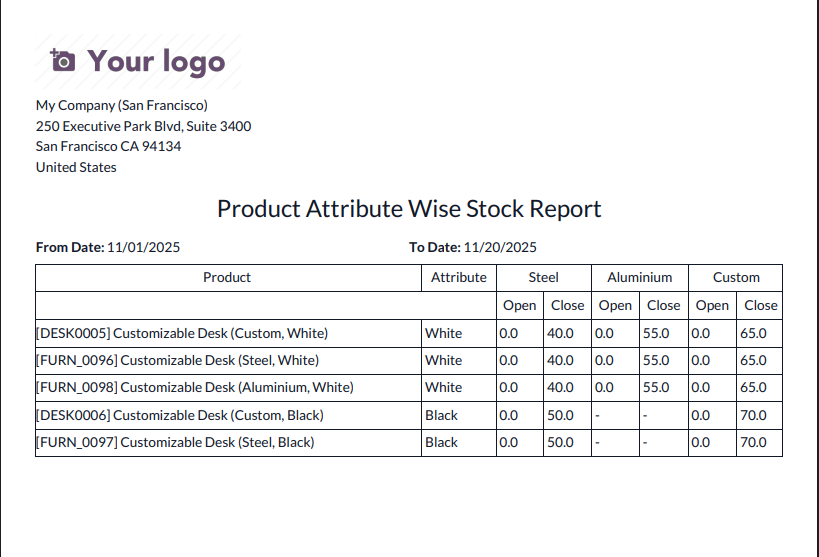
Product Attribute Wise Stock PDF Report
This report displays the Product Attribute Wise Stock Report in PDF format. It shows opening and closing stock quantities for each product based on selected attributes such as Steel, Aluminium, and Custom. The report includes product details, attribute values (e.g., White, Black), and stock movement summarized between the selected date range.
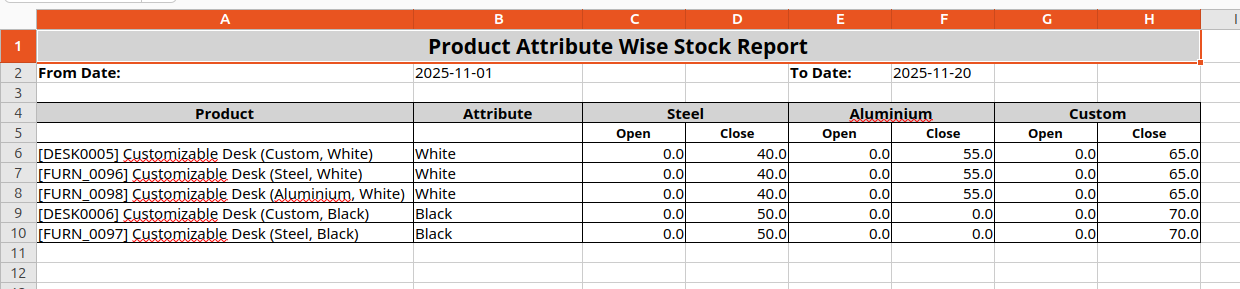
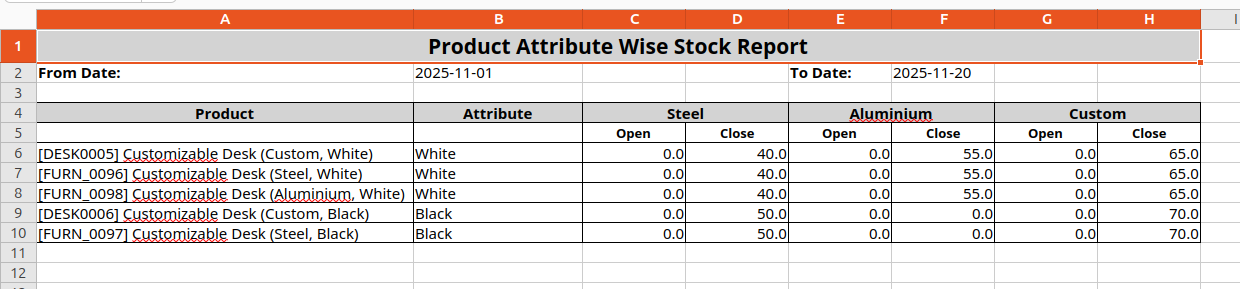
Product Attribute Wise Stock Excel Report
This Excel sheet shows the Product Attribute Wise Stock Report, summarizing opening and closing stock quantities for each product based on selected attributes like Steel, Aluminium, and Custom. The table includes product details, associated attribute values, and stock movement between the chosen date range, providing a clear comparative view across different attribute types.
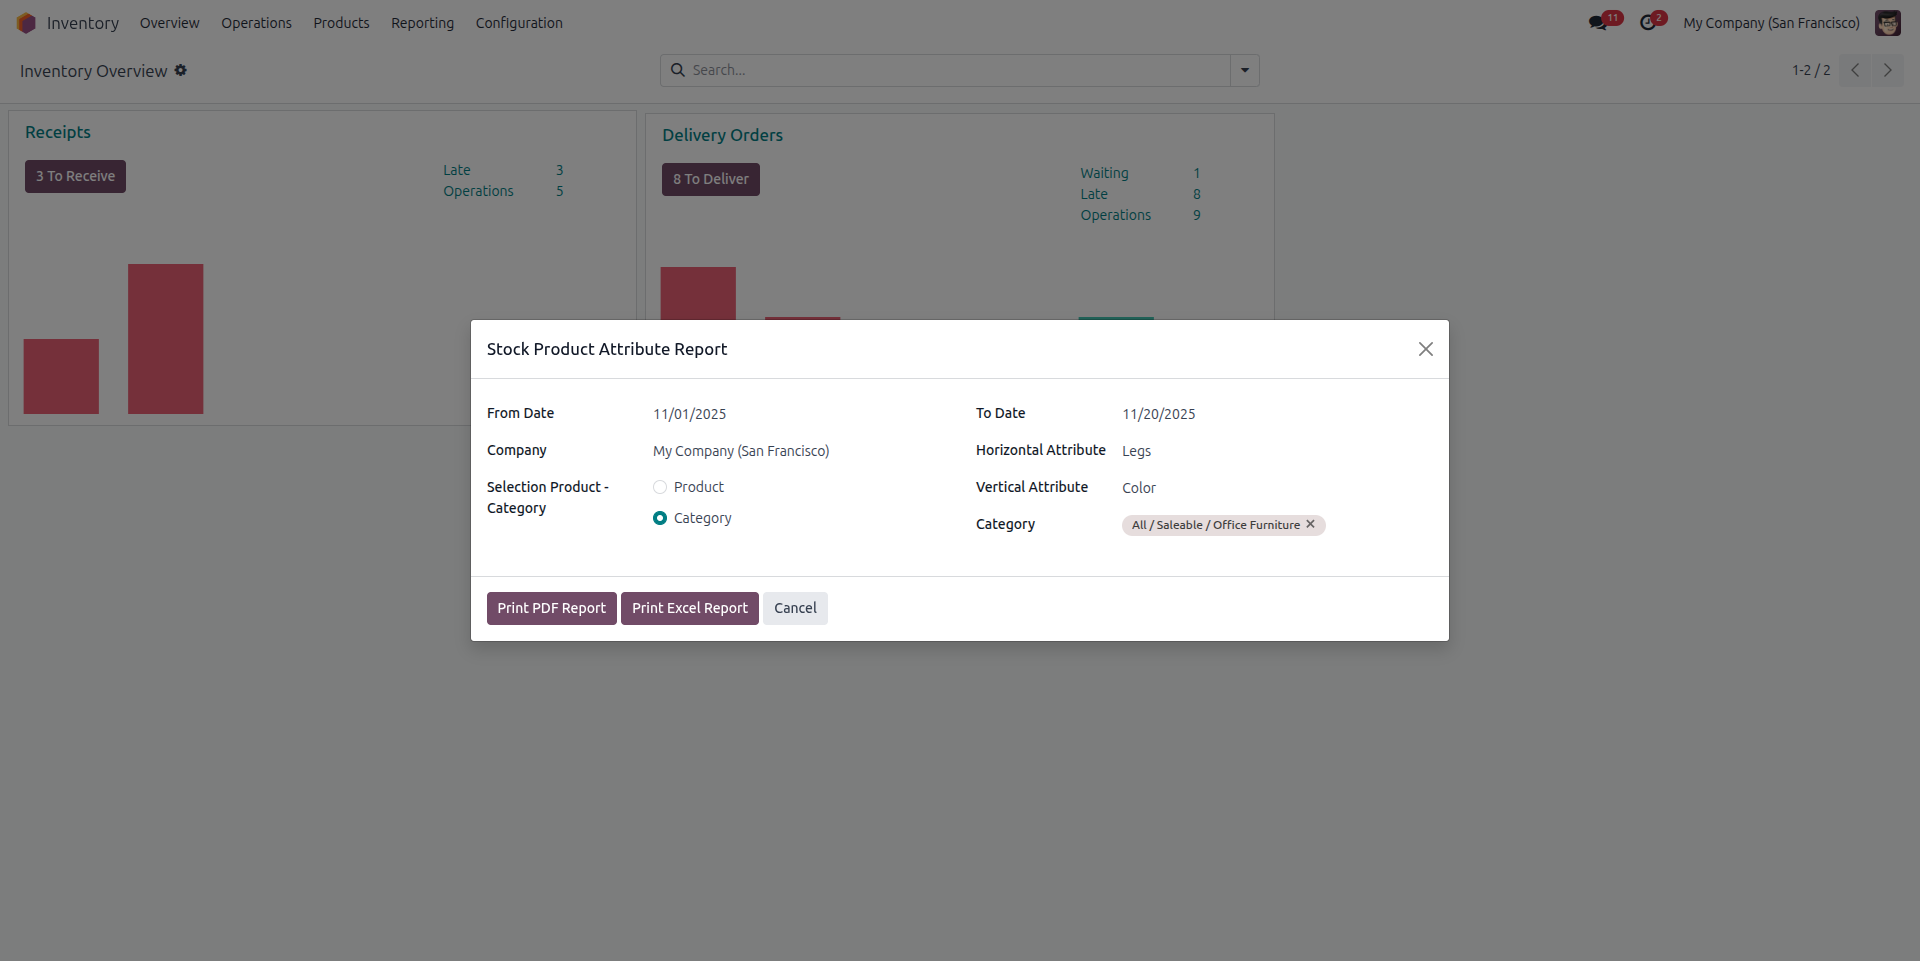
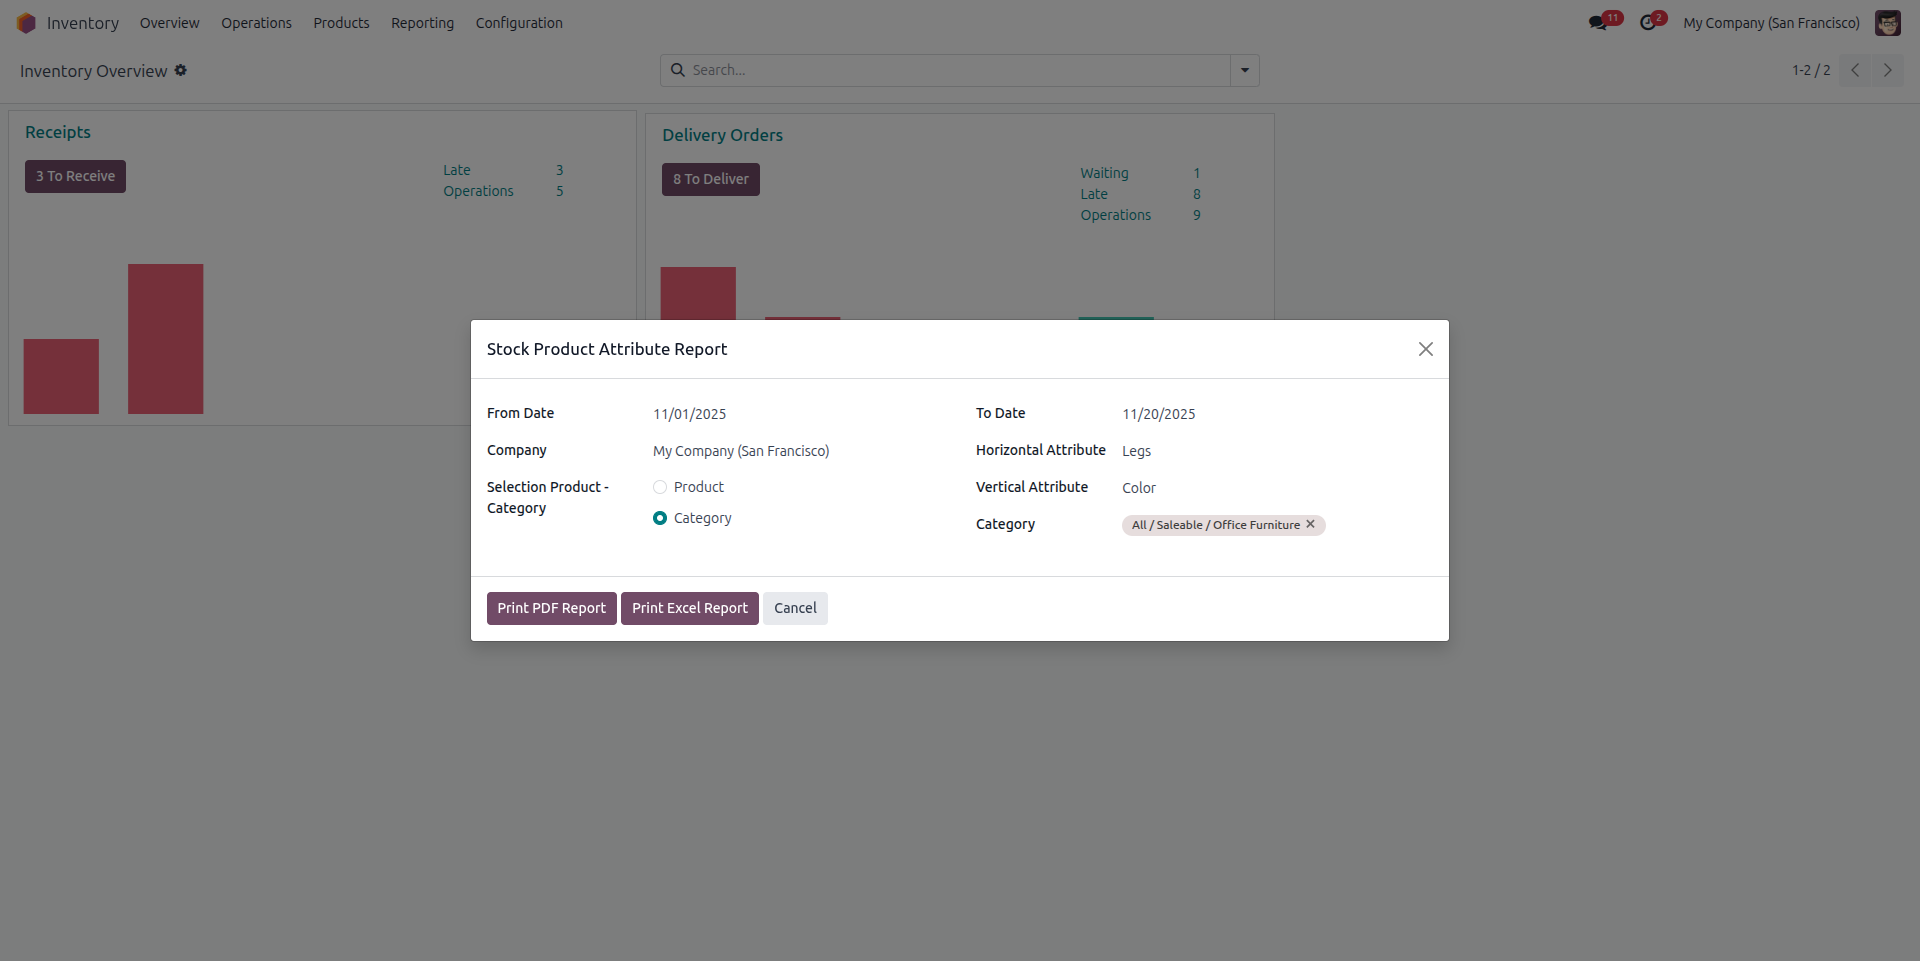
Stock Product Attribute Report Category Selection Wizard
This screen displays the Stock Product Attribute Report wizard configured for Category-based reporting. The user can choose a date range, define horizontal and vertical attributes (e.g., Legs and Color), and select product categories such as Saleable / Office Furniture. Once the options are set, the report can be generated in PDF or Excel format using the buttons at the bottom.
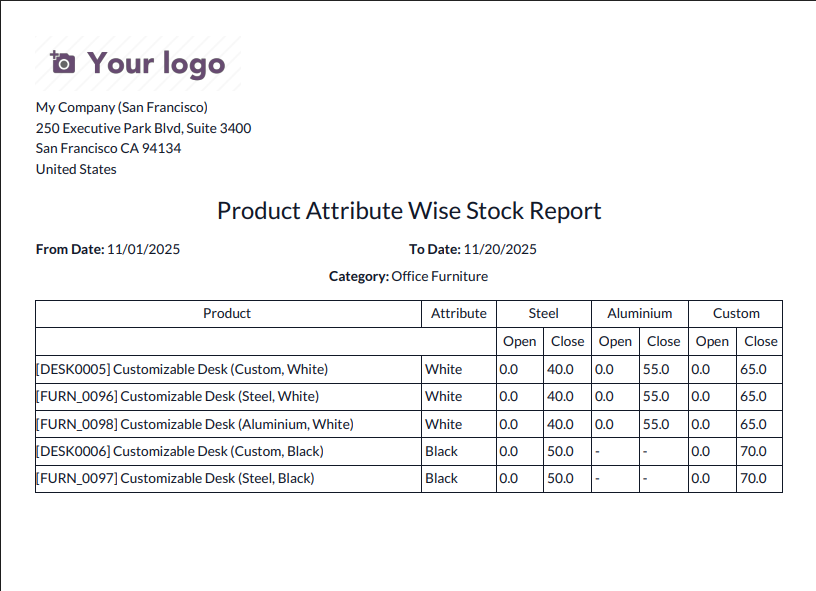
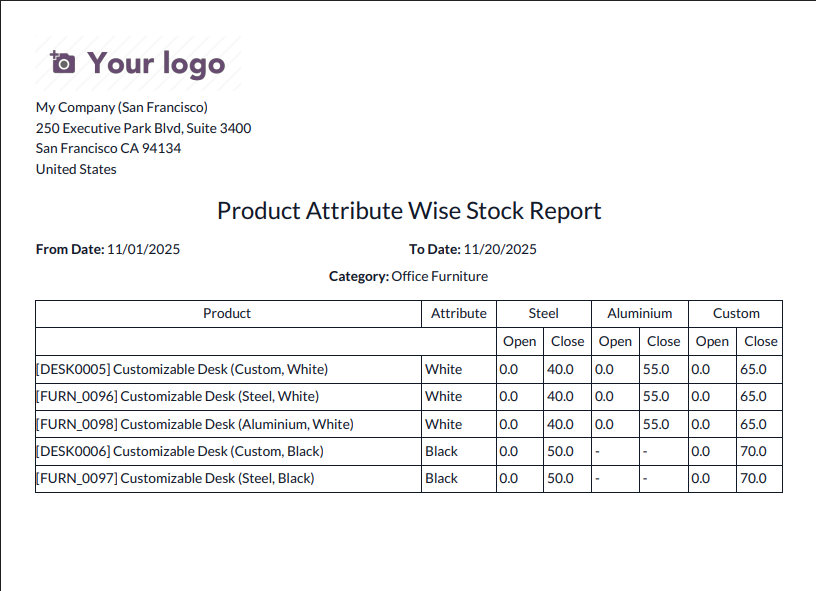
Product Attribute Wise Stock Category-Based PDF Report
This PDF output displays the Product Attribute Wise Stock Report filtered by the Office Furniture category. It shows opening and closing stock quantities for each product based on selected attributes—Steel, Aluminium, and Custom—within the specified date range. The report provides a clear comparison of stock movements for products grouped by their attribute values, such as White and Black.
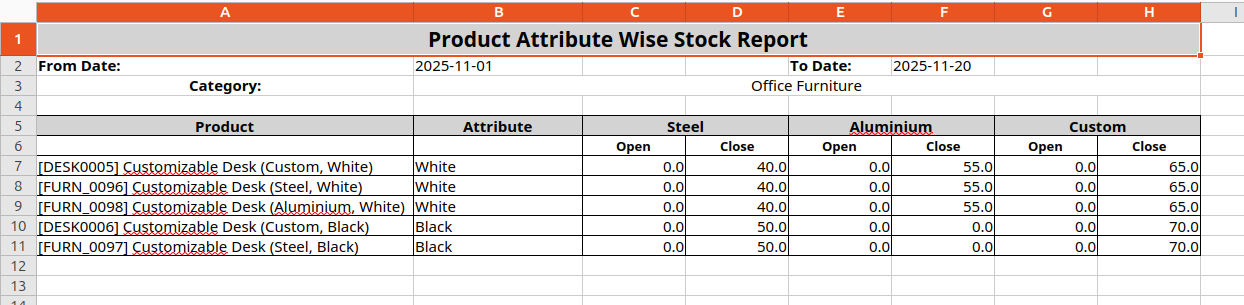
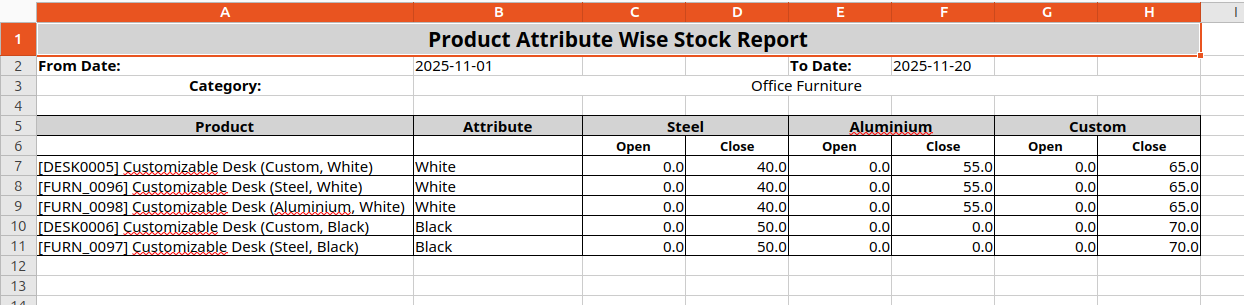
Product Attribute Wise Stock Category-Based Excel Report
This Excel sheet shows the Product Attribute Wise Stock Report generated for the Office Furniture category. It presents each product along with its attribute value (e.g., White, Black) and displays corresponding opening and closing stock quantities across attribute types such as Steel, Aluminium, and Custom. The report offers a clear, structured comparison of stock levels within the selected date range.
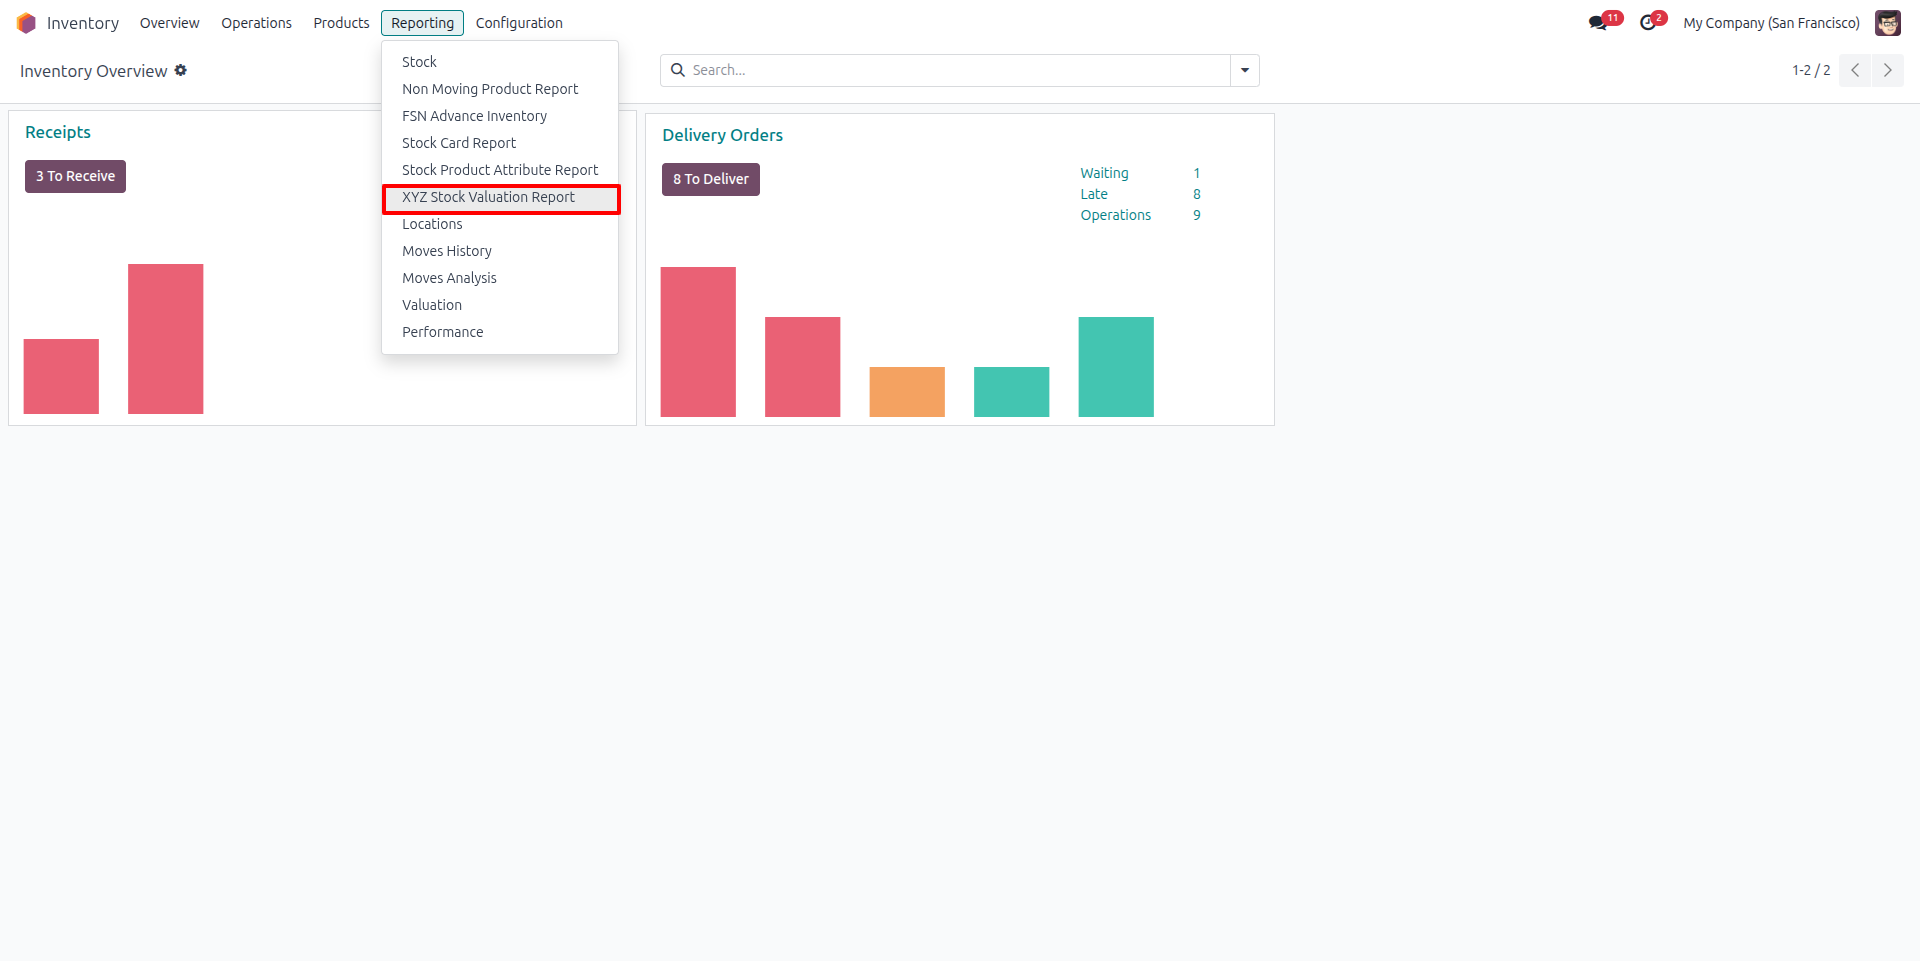
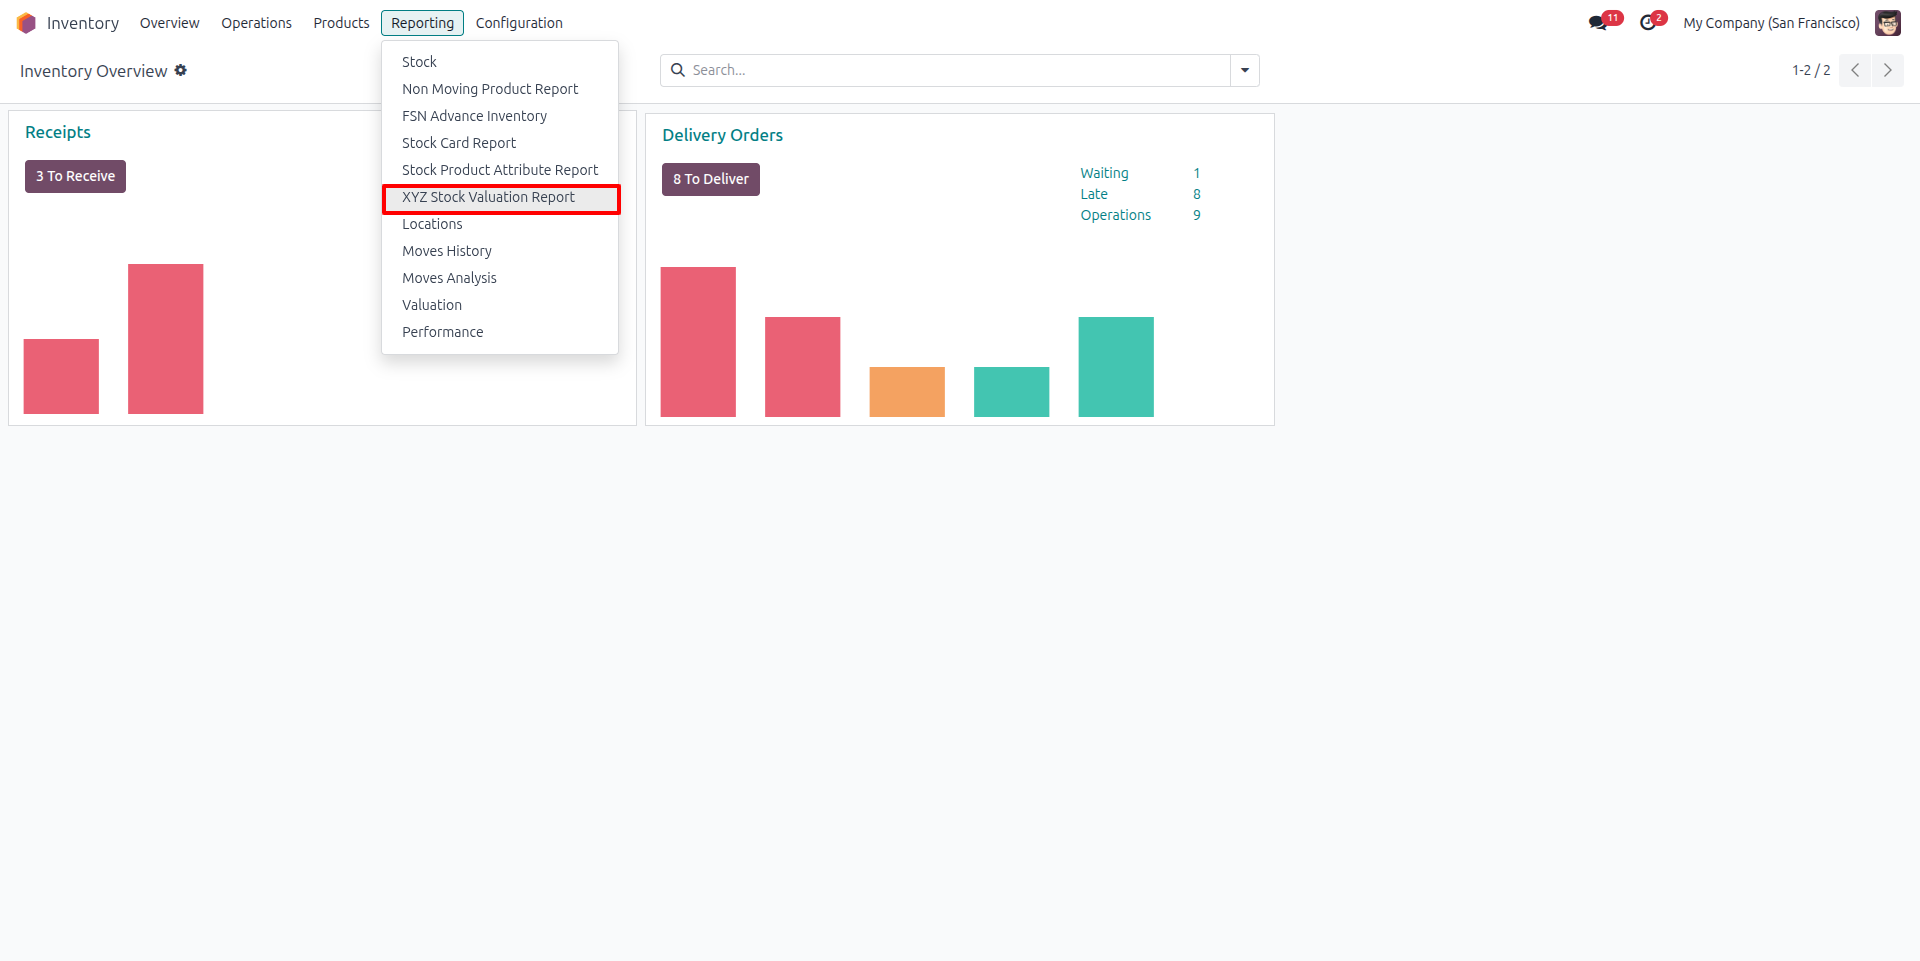
XYZ Stock Valuation Report Menu Access
This image shows the Inventory → Reporting dropdown menu where the new “XYZ Stock Valuation Report” option is available. Users can access this report directly from the reporting section to generate detailed stock valuation insights for selected products, categories, or locations.
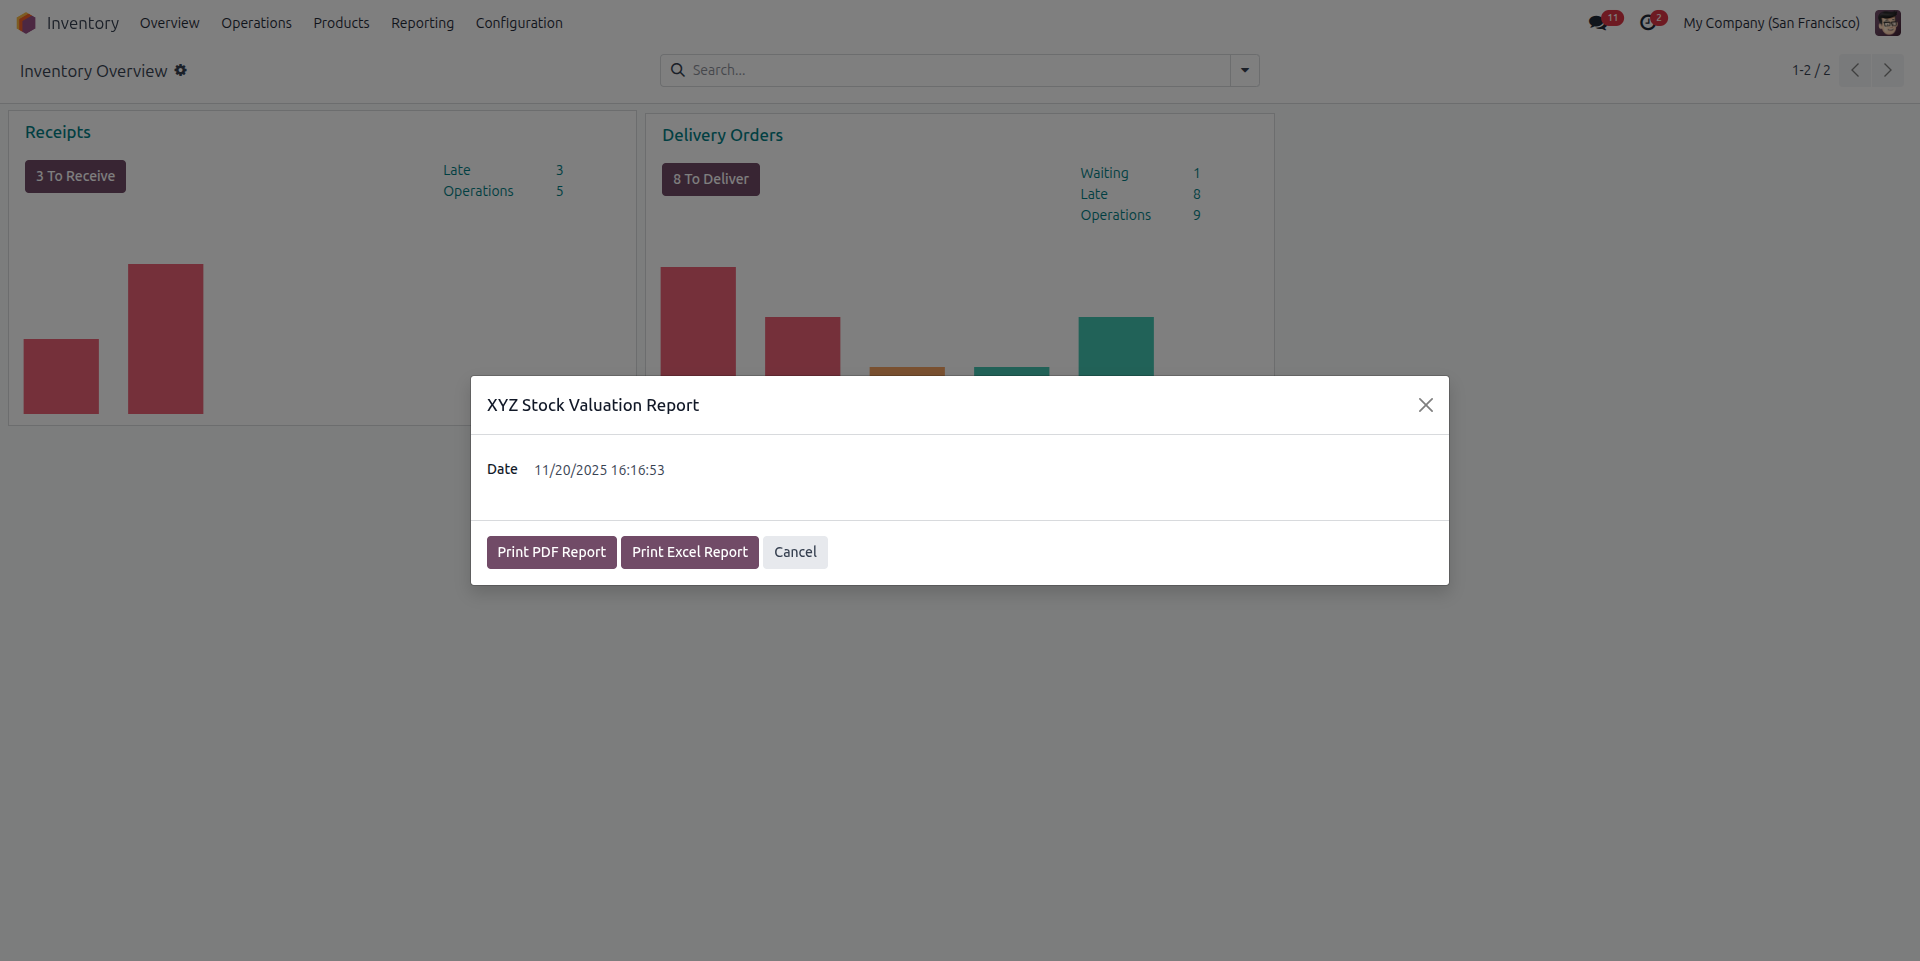
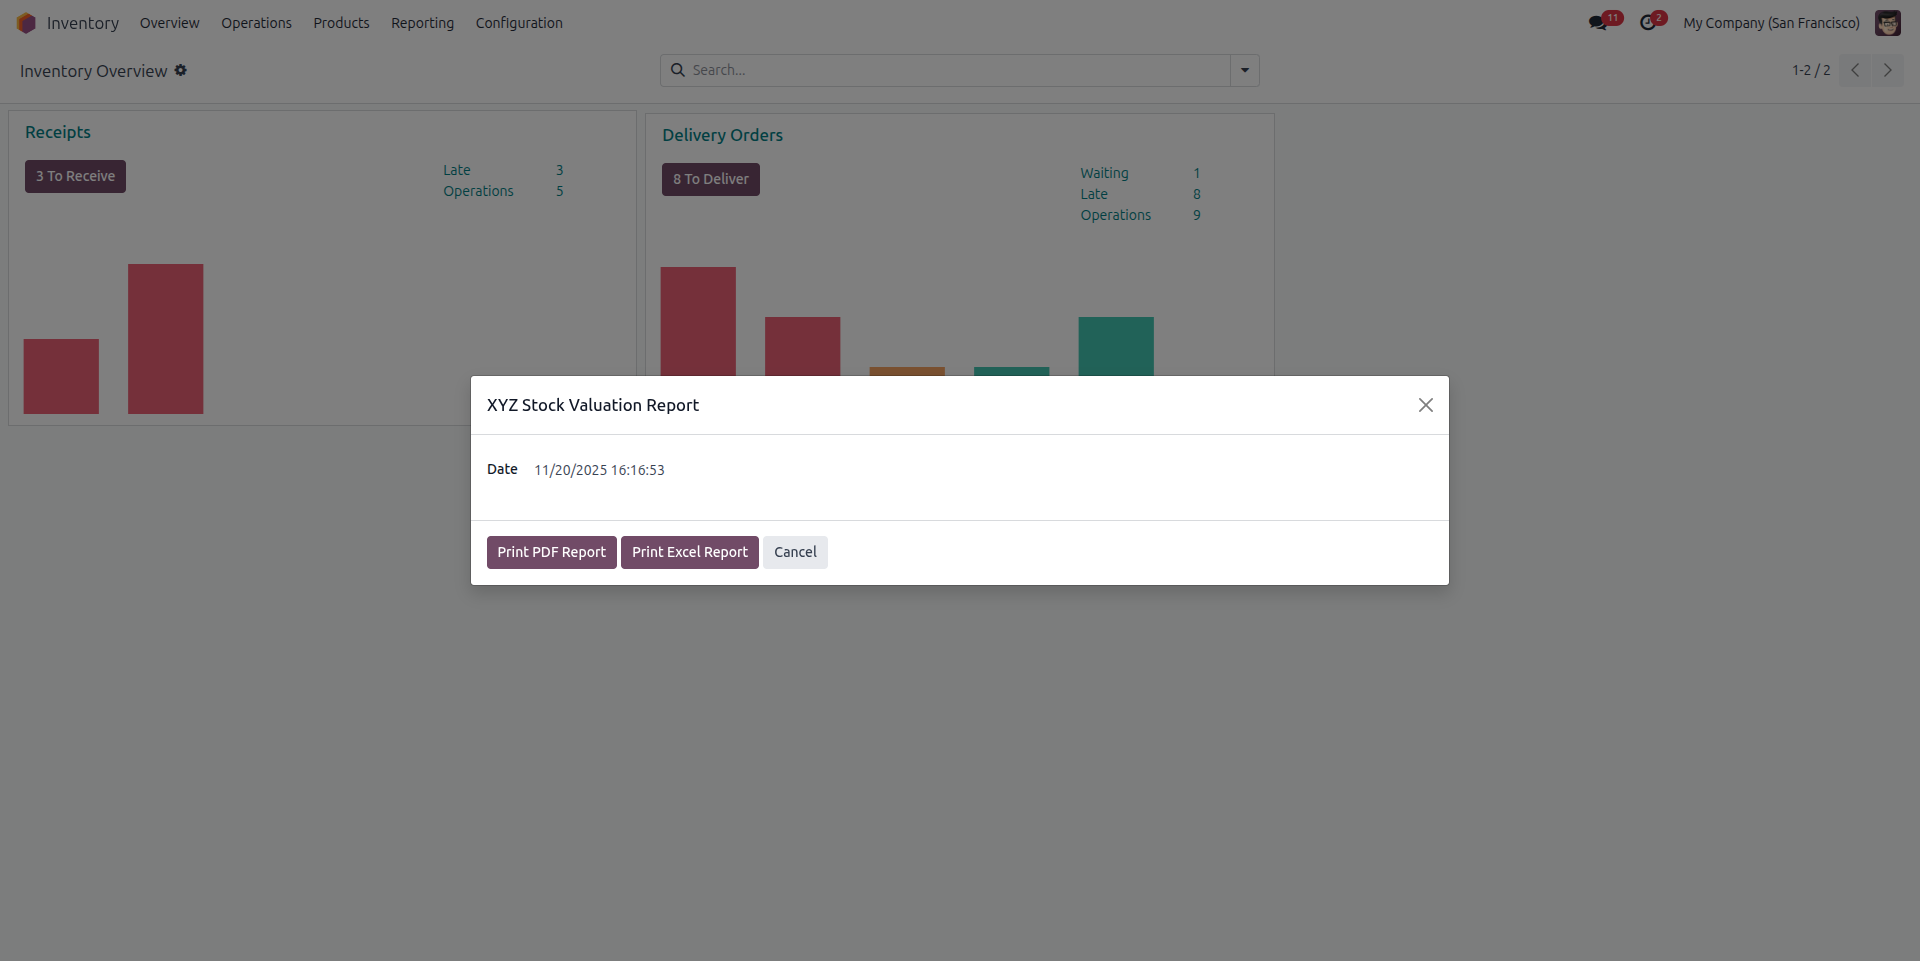
XYZ Stock Valuation Report Wizard
This screen displays the XYZ Stock Valuation Report wizard, where users can generate a valuation report based on the current stock status as of the selected date and time. The wizard provides quick options to export the valuation details in PDF or Excel formats, making it easy to review real-time stock value for accounting or inventory analysis.
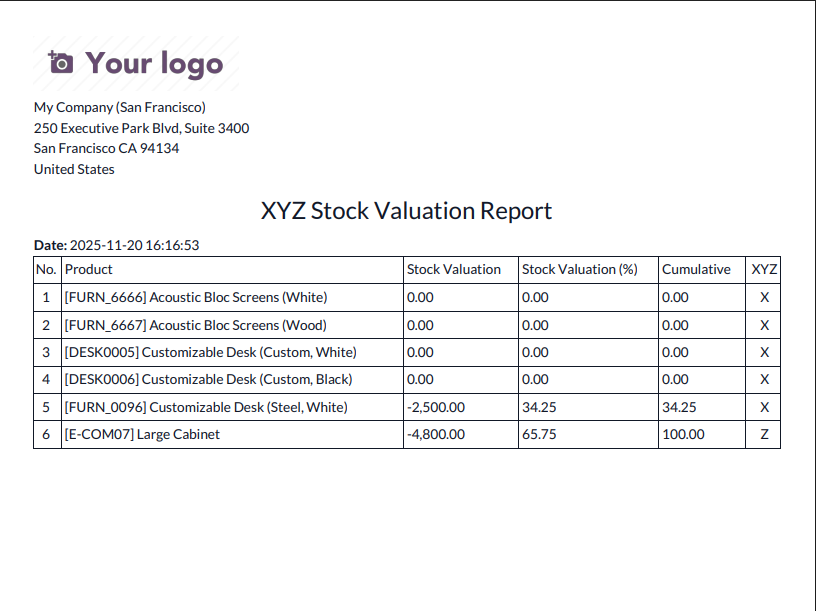
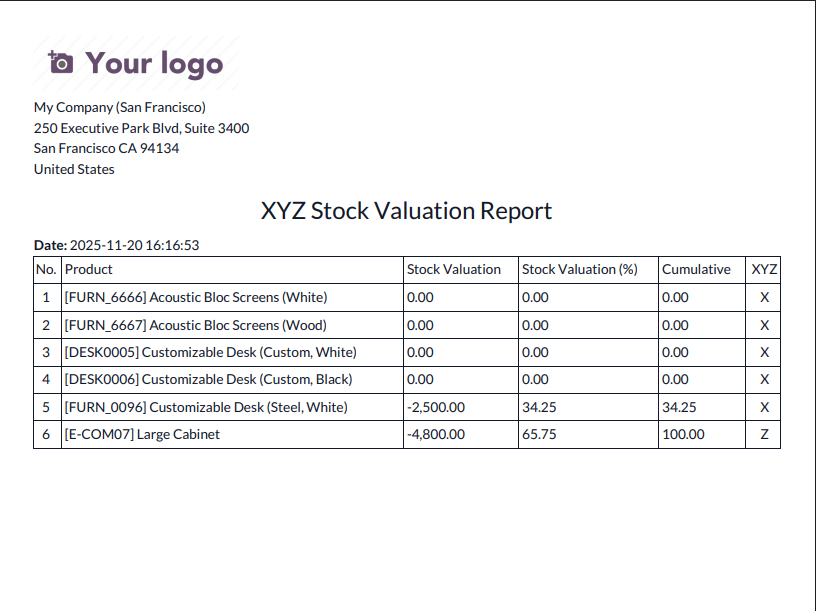
XYZ Stock Valuation PDF Report
This report displays product-wise stock valuation along with percentage contribution, cumulative values, and their assigned XYZ category. It helps identify which items contribute most or least to overall inventory value by classifying them into X, Y, or Z groups based on cumulative percentage.
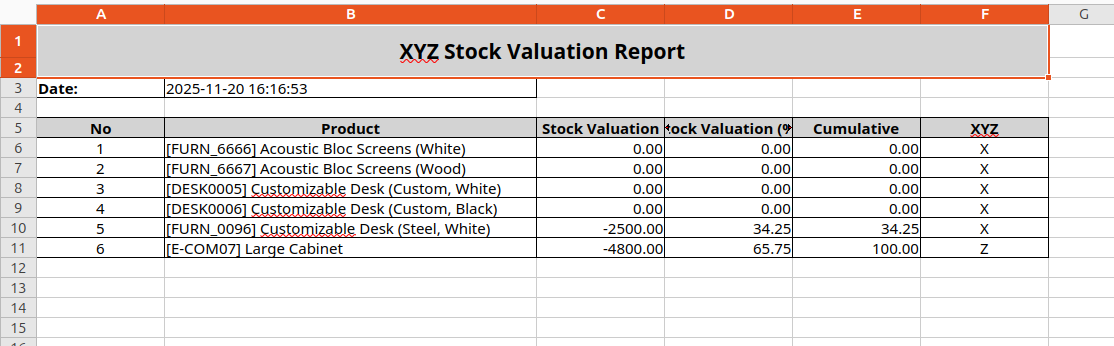
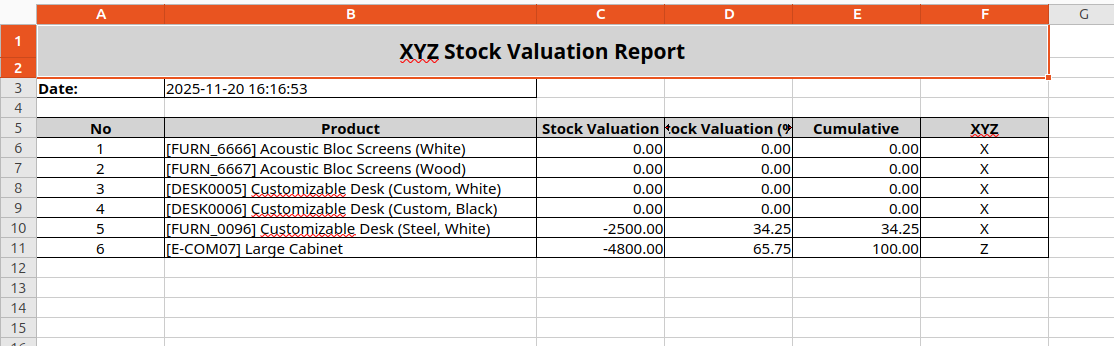
XYZ Stock Valuation Excel Report
This screen displays the XYZ Stock Valuation Report in Excel format, summarizing each product’s stock valuation, valuation percentage, cumulative distribution, and final XYZ classification based on value contribution. It helps quickly identify high-value (X), medium-value (Y), and low-value (Z) items for effective inventory control.

Our Services

Our Industries

Support



Technical Information
kx_all_in_one_stock_report
stock
sale_management
Supported Versions
18.0.1.0
₹ 14,226.48
19.0.1.0
₹ 14,226.48