Choosing the right business analytics software is no longer just an IT decision. It affects how quickly your team can spot trends, share reports, trust the numbers, and act on opportunities. For growing companies, the real question is not which tool is “best” in general, but which one fits your data maturity, reporting needs, budget, and internal workflows. That is why the Power BI vs Tableau vs Looker debate matters so much for businesses building a modern analytics platform for business.
Why this BI tool comparison matters
Most companies looking for tools for business intelligence want three things :
reliable dashboards, clear reporting, and faster decisions. But these three platforms solve that problem in different ways. Power BI is strong for organizations already using Microsoft tools. Tableau stands out for data storytelling and visual exploration. Looker is built for teams that care deeply about governed metrics, reusable business logic, and embedded analytics inside products or workflows.

Another important point :
Looker and Looker Studio are not the same product. Looker Studio is Google’s easier, no-cost reporting tool, while Looker is the enterprise platform discussed in this article. That distinction matters because many businesses compare the wrong tools and end up misjudging cost, complexity, and long-term scalability.

Power BI : best for Microsoft-first businesses
Power BI is one of the most practical choices for companies that already work inside the Microsoft ecosystem. Microsoft describes it as a unified, scalable platform for self-service and enterprise BI, and that positioning is exactly why it appeals to small businesses, mid-sized firms, and larger enterprises alike. It connects naturally with Excel, Microsoft 365, and broader Microsoft data workflows, making adoption easier for teams that do not want a steep learning curve.
Power BI also supports managed self-service BI through shared semantic models, which helps organizations maintain consistency while still letting business users build reports. That makes it a strong fit for finance dashboards, sales reporting, operations tracking, and performance analytics. From a pricing perspective, Power BI is typically easier to enter than the other two platforms, with Microsoft’s current commercial pricing showing Power BI Pro at a lower user-level entry point than many enterprise BI alternatives.

Best fit for :
Small to mid-sized businesses, Microsoft-heavy teams, cost-conscious organizations, and companies that want fast deployment of dashboard reporting tools without a large analytics engineering layer.
Tableau : best for advanced visualization and storytelling
If your business wants highly polished dashboards and strong visual exploration, Tableau remains a leading option. Tableau defines itself as a visual analytics platform, and that focus shows in the user experience. It is widely preferred by teams that want to turn complex datasets into clean, compelling, interactive visuals that leadership can understand quickly.
Tableau is especially valuable when dashboard presentation matters as much as the analysis itself. It gives analysts more flexibility in how they design visual stories, which is why it is often favored by teams building executive dashboards, client-facing analytics, or deep exploratory reports. The trade-off is pricing. Tableau’s official pricing structure is notably higher than Power BI at the Creator and Explorer levels, so businesses need to be confident they will use that extra visualization power

Best fit for :
Data teams that prioritize design quality, exploratory analysis, and premium data visualization tools for internal stakeholders or client reporting.
Looker : best for governed enterprise analytics
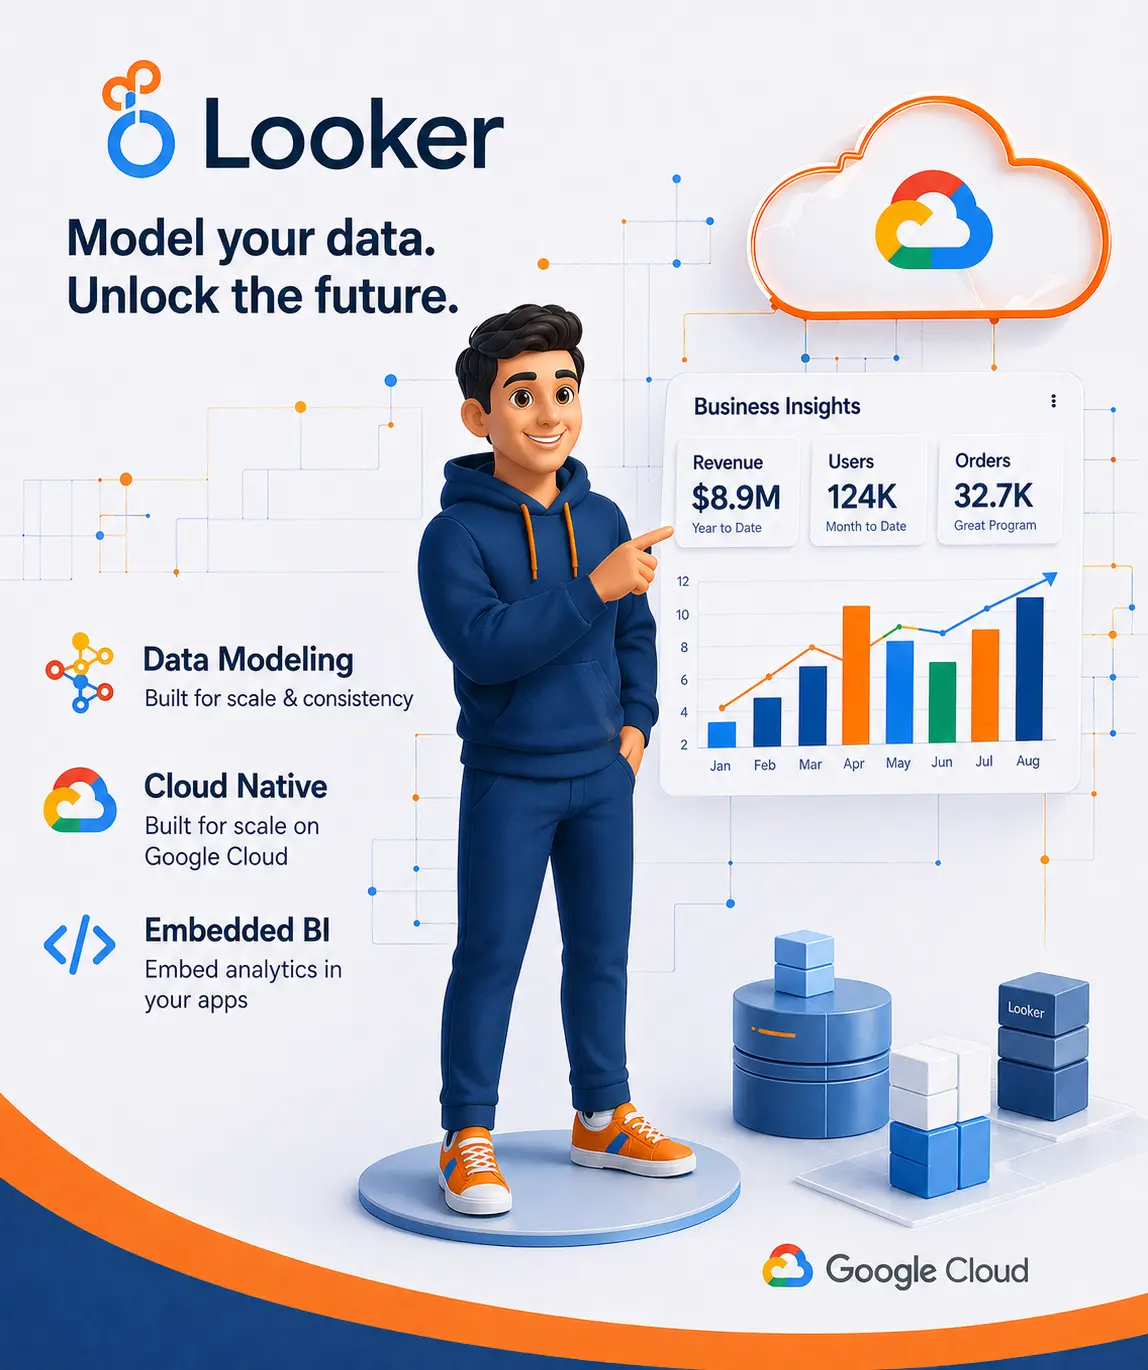
Looker is different from both Power BI and Tableau in one major way: it is not only a dashboard tool. Google Cloud positions it as a platform for BI, data applications, and embedded analytics. That makes it especially attractive for businesses that want governed metrics, reusable definitions, stronger control over business logic, and analytics that can live inside products or customer portals.
Looker’s semantic modeling approach is one of its biggest strengths. Google highlights the value of defining metrics once and using them everywhere, which supports governance, consistency, and trust in reporting. For enterprise environments where multiple teams need the same revenue, margin, or customer definitions, that is a major advantage. The downside is that Looker usually makes more sense for organizations with a mature cloud data stack and stronger technical ownership. Its pricing is also structured around platform and user components rather than a simpler per-user model.
Best fit for :
Larger organizations, digital products, data-led enterprises, and teams that need embedded analytics platforms or tighter metric governance.
Power BI vs Tableau vs Looker : which one should you choose?

Power BI
If your business wants affordable, familiar, and scalable business intelligence analytics, choose Power BI. It is often the strongest all-around option for companies that want quick wins and lower friction.

Tableau
If your priority is presentation, storytelling, and richer visual exploration, choose Tableau. It is one of the best BI tools for turning analysis into polished visuals that decision-makers actually use.

Looker
If your business needs governed definitions, cloud-native modeling, and analytics embedded into workflows or products, choose Looker. It is often the better strategic choice for enterprise environments where consistency and scalability matter more than quick setup.
Conclusion
There is no single winner in this BI tool comparison. The right choice depends on your team structure, reporting maturity, and long-term analytics goals. For many growing businesses, Power BI offers the best balance of cost, usability, and business value. Tableau is ideal when visual storytelling is a competitive advantage. Looker is the stronger option when your analytics strategy depends on governance, embedded experiences, and a deeper enterprise data foundation.
At KoderXpert, your Data Analytics Services & Power BI Consulting page already emphasizes KPI analysis, dashboard development, data storytelling, and Power BI integration. That makes this topic a strong fit for attracting comparison-intent traffic and then guiding visitors toward implementation support, dashboard strategy, and business intelligence services.
Frequently Asked Questions
For many small and mid-sized businesses, Power BI is often the most accessible option because it combines self-service and enterprise BI with a lower barrier to entry than many alternatives.
Not universally. Tableau is often stronger for advanced visual storytelling, while Power BI is usually more attractive for Microsoft-first organizations and budget-conscious teams.
It can be, especially when a business needs governed metrics, centralized business logic, and embedded analytics across products or teams.
No. Looker Studio is Google’s no-cost reporting tool, while Looker is the broader enterprise BI platform.
Start with your real needs: budget, technical resources, dashboard complexity, governance requirements, and whether you need self-service reporting or enterprise-grade modeling. Then choose the platform that fits that operating reality, not just the most popular brand.

Not Sure Which BI Tool Is
Right for You?
Still not sure which BI tool fits your workflows, reporting needs, and growth plans? KoderXpert helps businesses design dashboards, streamline reporting, and choose the right analytics stack with practical implementation support. Explore our Data Analytics Services to turn raw data into smarter decisions.